Revenue metrics without a full analytics stack
Orders per day, revenue by payment method, best channel this month. One track call in your checkout code, stored in the database you already run.
The problem
Everyone needs these charts. Nobody wants to run a warehouse for them.
Most apps answer "how did sales do last month" one of two ways. Either someone runs GROUP BY DATE(created_at) against the orders table until those queries get slow, or the company wires up a full analytics stack with event pipelines and a warehouse for what is, honestly, a handful of counters.
There is a middle ground: pre-aggregated rollups your app owns, written at checkout time, queryable from Ruby. That is what Trifle::Stats does.
What you track
One call where the order completes. Totals plus breakdowns, in one write.
The values hash can be nested, and every numeric leaf gets incremented. So one call counts the order, adds the revenue, and files both under the payment method and the sales channel that produced them.
Every configured granularity gets its own bucket. The same call updates the hourly, daily, weekly, and monthly rollups. No cron job re-aggregating anything at 2am.
Model before you track
Nest only what has a small, fixed cardinality. Payment methods and channels are perfect: there are five of them, and there will be five of them next year. Unbounded things like tenants belong in the key instead: orders::completed::tenant::#{tenant.id}. Track the global key and the per-tenant key and you get the overview and the drill-down for the price of two increments.
Trifle::Stats.track(
  key: 'orders::completed',
  at: Time.zone.now,
  values: {
    count: 1,
    revenue_cents: order.total_cents,
    payment: {
      order.payment_method => {
        count: 1,
        revenue_cents: order.total_cents
      }
    },
    channel: {
      order.channel => {
        count: 1,
        revenue_cents: order.total_cents
      }
    }
  }
)
What you get back
Every branch you tracked is a queryable time series. No metric definitions, no schema.
{
  "count"         => 128,
  "revenue_cents" => 1034400,
  "payment" => {
    "card"   => { "count" => 97, "revenue_cents" => 801200 },
    "paypal" => { "count" => 31, "revenue_cents" => 233200 }
  },
  "channel" => {
    "web"    => { "count" => 84, "revenue_cents" => 691800 },
    "mobile" => { "count" => 44, "revenue_cents" => 342600 }
  }
}series = Trifle::Stats.series( key: 'orders::completed', from: 30.days.ago, to: Time.zone.now, granularity: '1d' ) # Total revenue over 30 days series.aggregate.sum(path: 'revenue_cents') # Card orders only series.aggregate.sum(path: 'payment.card.count') # Average daily mobile revenue series.aggregate.mean(path: 'channel.mobile.revenue_cents') # Best day by order count series.aggregate.max(path: 'count')
This is one daily bucket. After a day of orders it holds the totals and every breakdown, kept in sync automatically because they were incremented together.
Retrieval takes a timeframe and a granularity, and aggregators run over any dot-path in the tree. Notice that "card orders per day" was never declared as a metric anywhere. It just falls out of the data model.
With a plain counter tool this would be five or six separate metrics you keep in sync and query one by one. Here it is one key.
Dashboards and alerts on top
Trifle App reads the same buckets from the same database. Nothing to export.
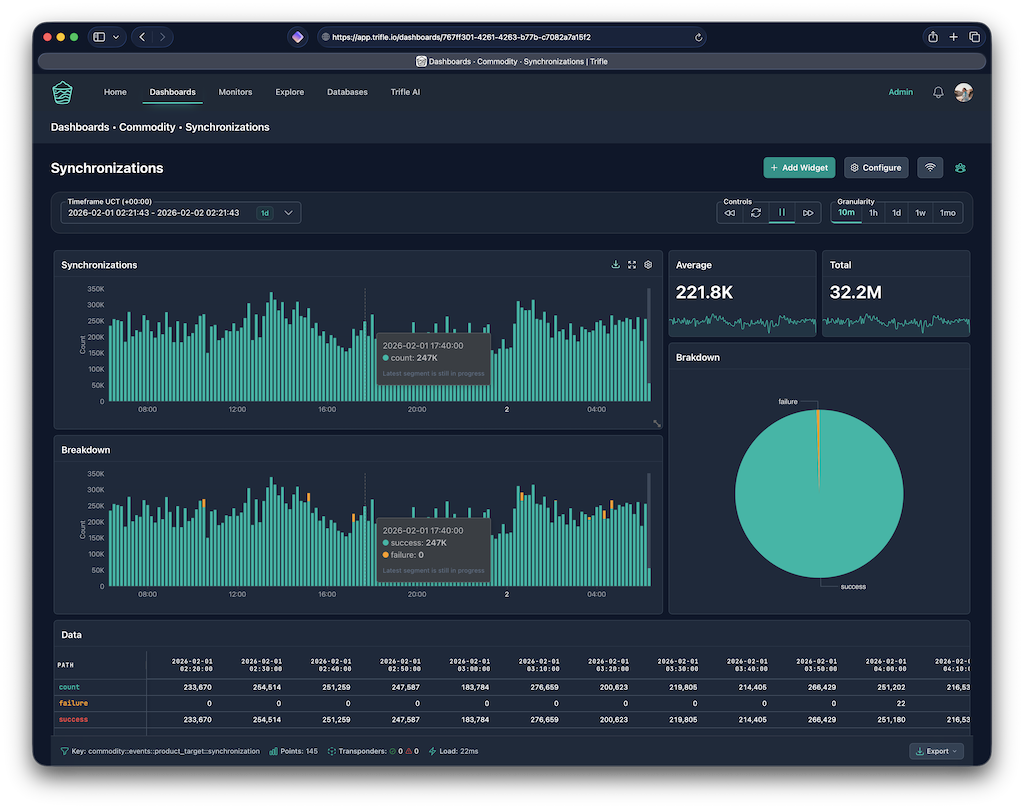
Connect Trifle App to the PostgreSQL or MongoDB your app already writes to and the revenue dashboard builds itself from the paths you tracked: revenue over time, orders by payment method, channel split.
- Anomaly alerts when revenue drops out of its normal range, delivered to Slack before anyone asks.
- Daily digests that snapshot the dashboard and land in the channel every morning.
- Self-serve access for the founder or PM who keeps asking for the numbers.
Keep reading
The long-form version of this page, with all the modeling advice.
Track your first order today
One initializer, one track call. The charts follow.