Your metrics, visualized.
Build interactive dashboards, set up alerts, and schedule daily digests. No code required for non-technical team members.
Everything you need to act on your data
From real-time dashboards to scheduled reports, Trifle App gives your entire team access to the metrics that matter.
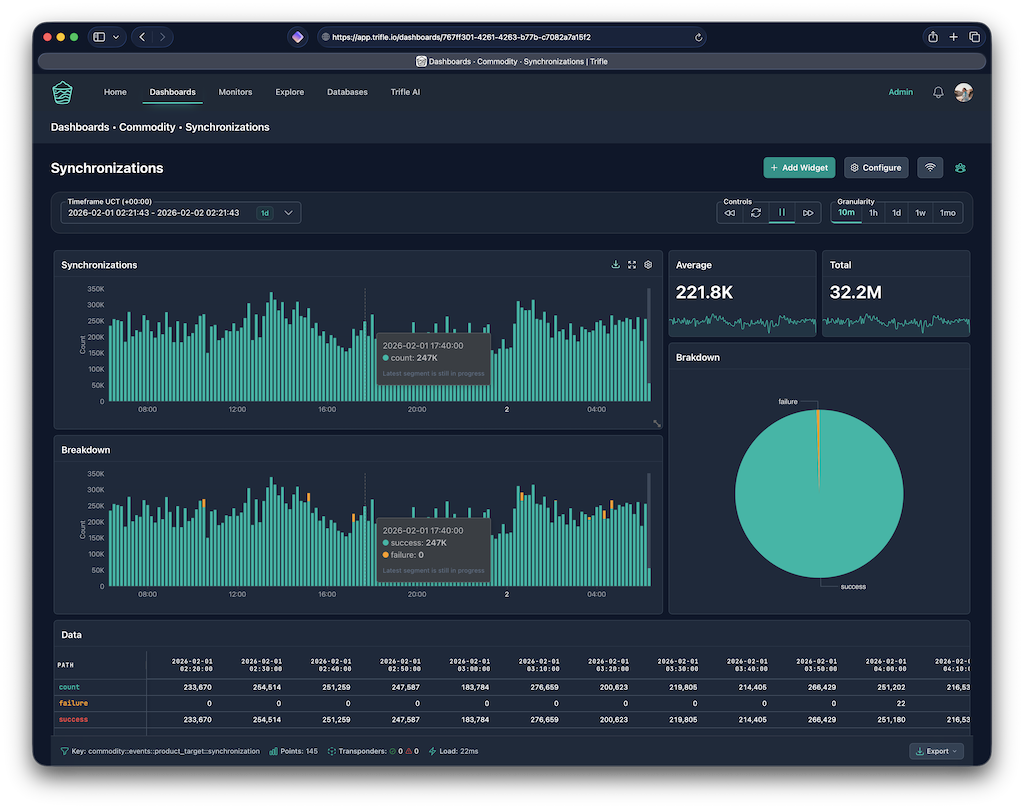
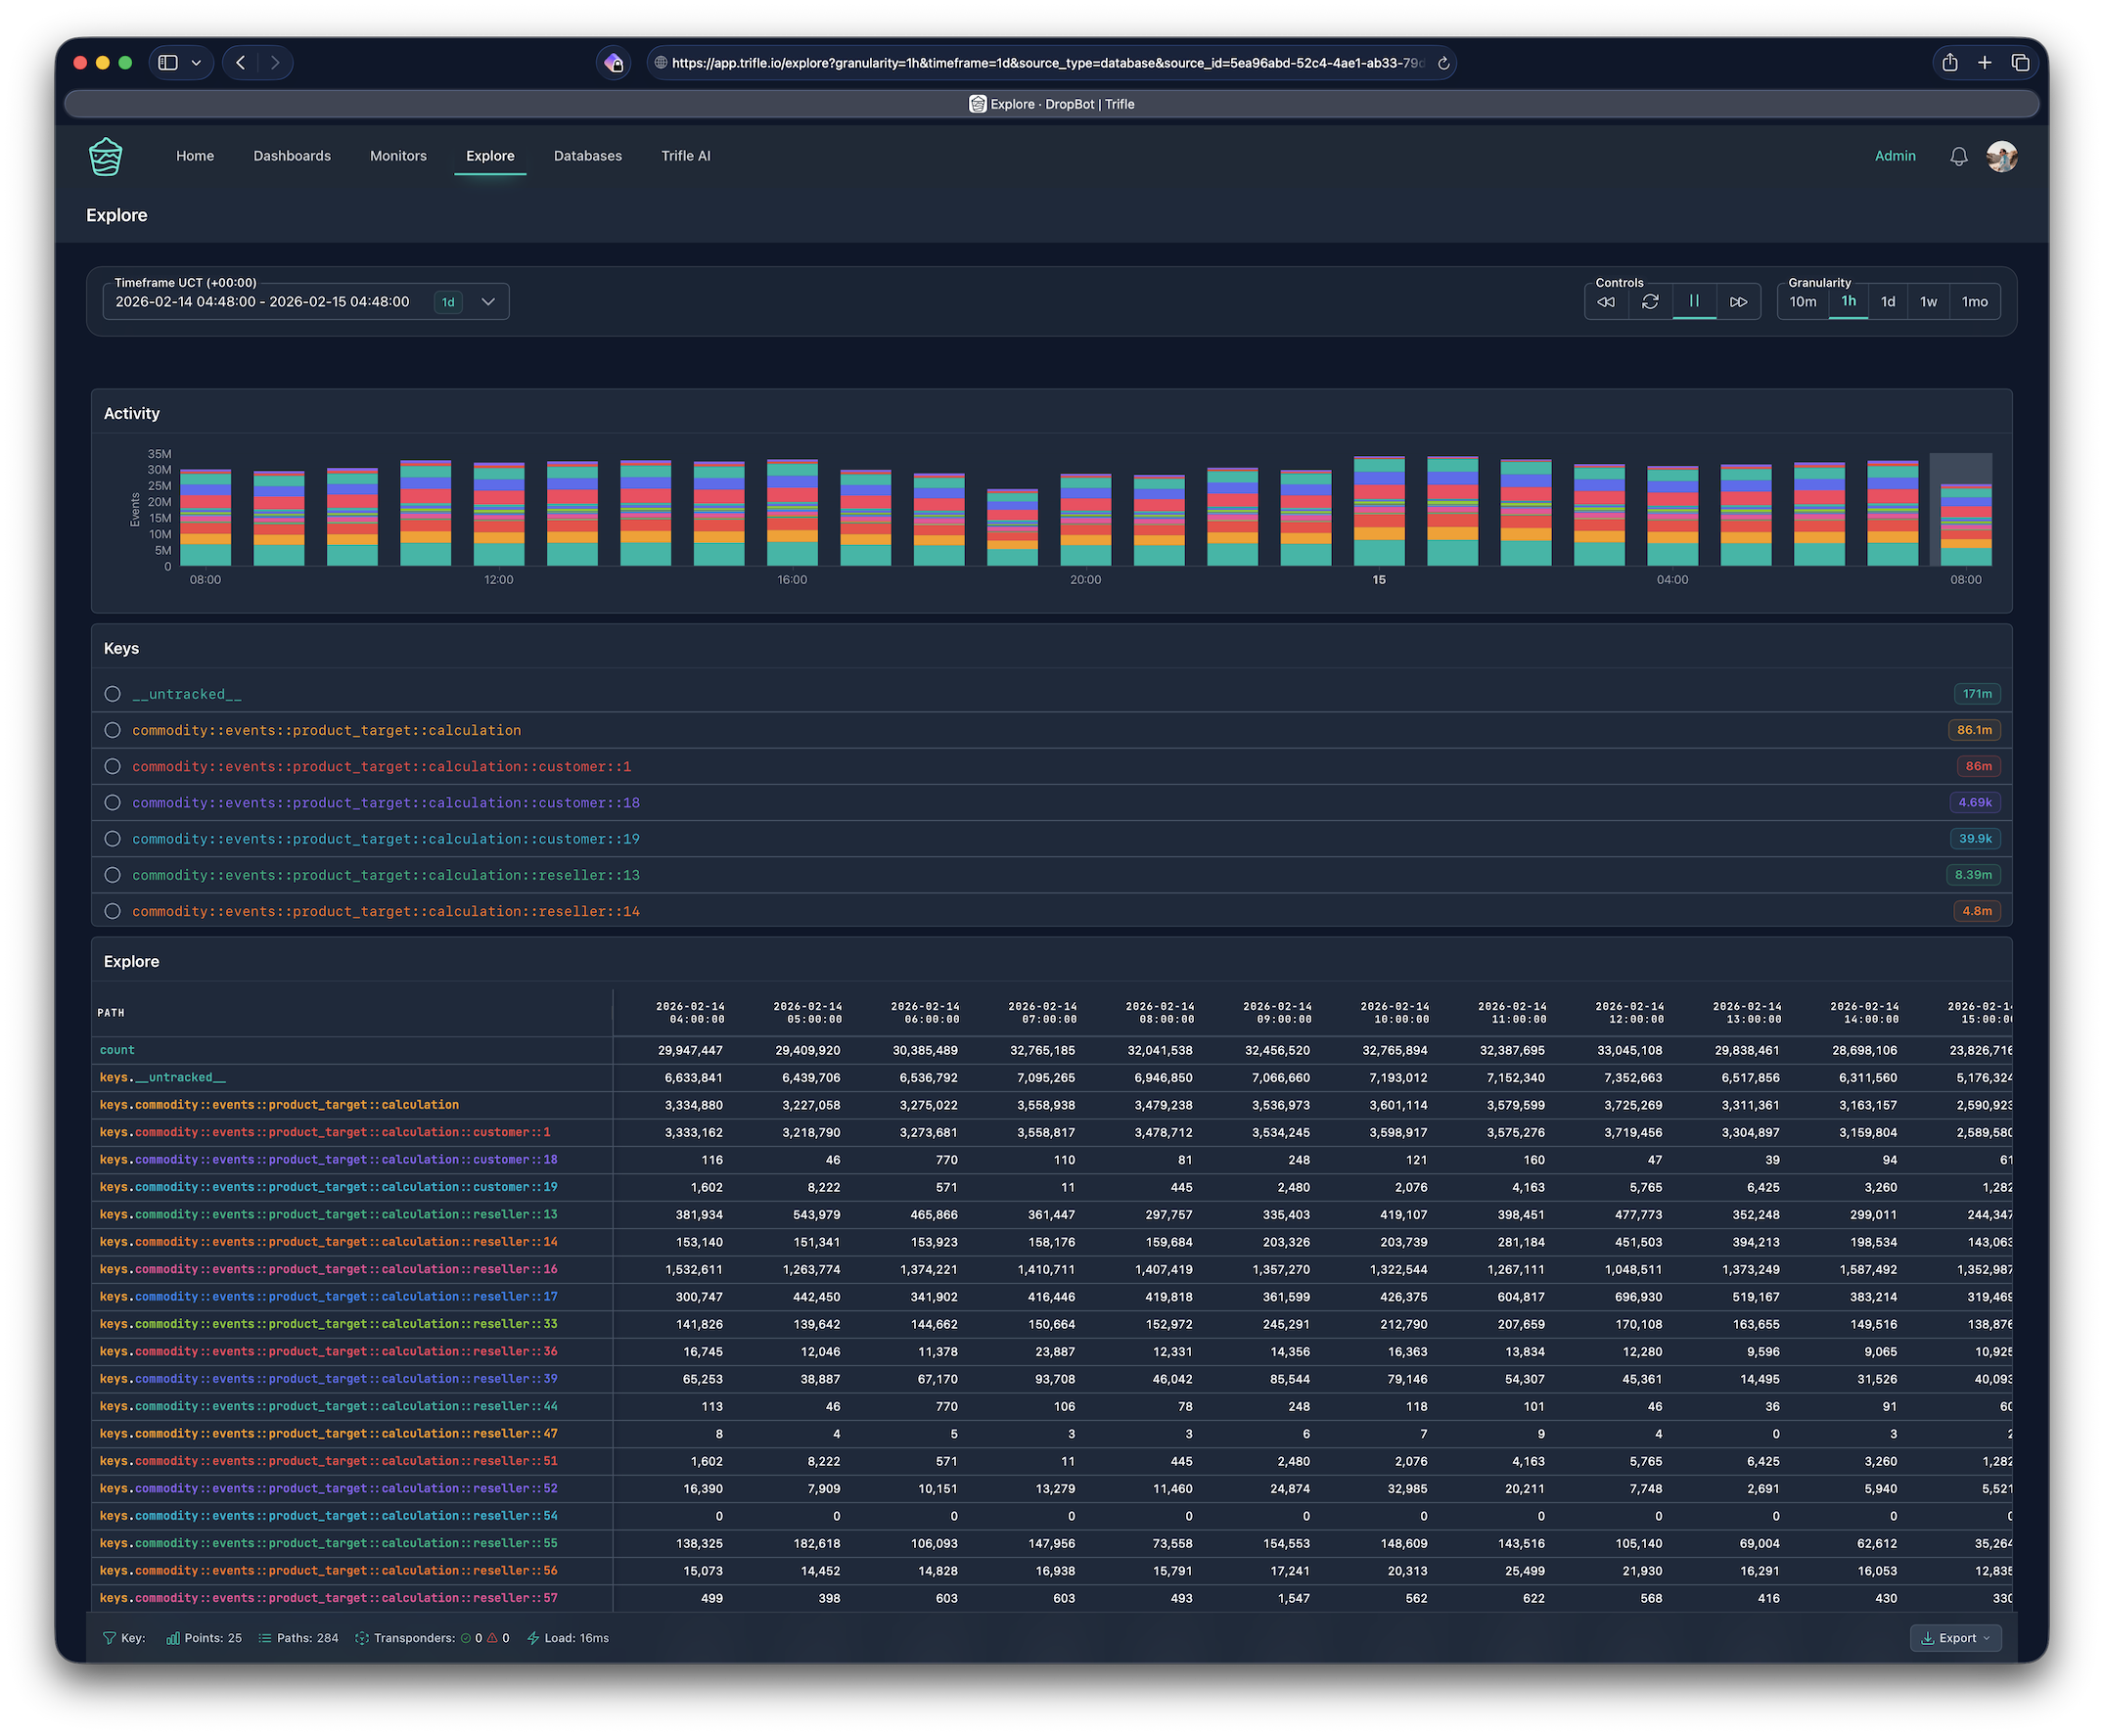
Explore every metric at a glance
See all your tracked keys, their activity over time, and raw data in a single view. Build drag-and-drop dashboards mixing time-series charts, category breakdowns, and KPI numbers.
Activity charts, key listings, and tabular breakdowns update in real time as you navigate your data.
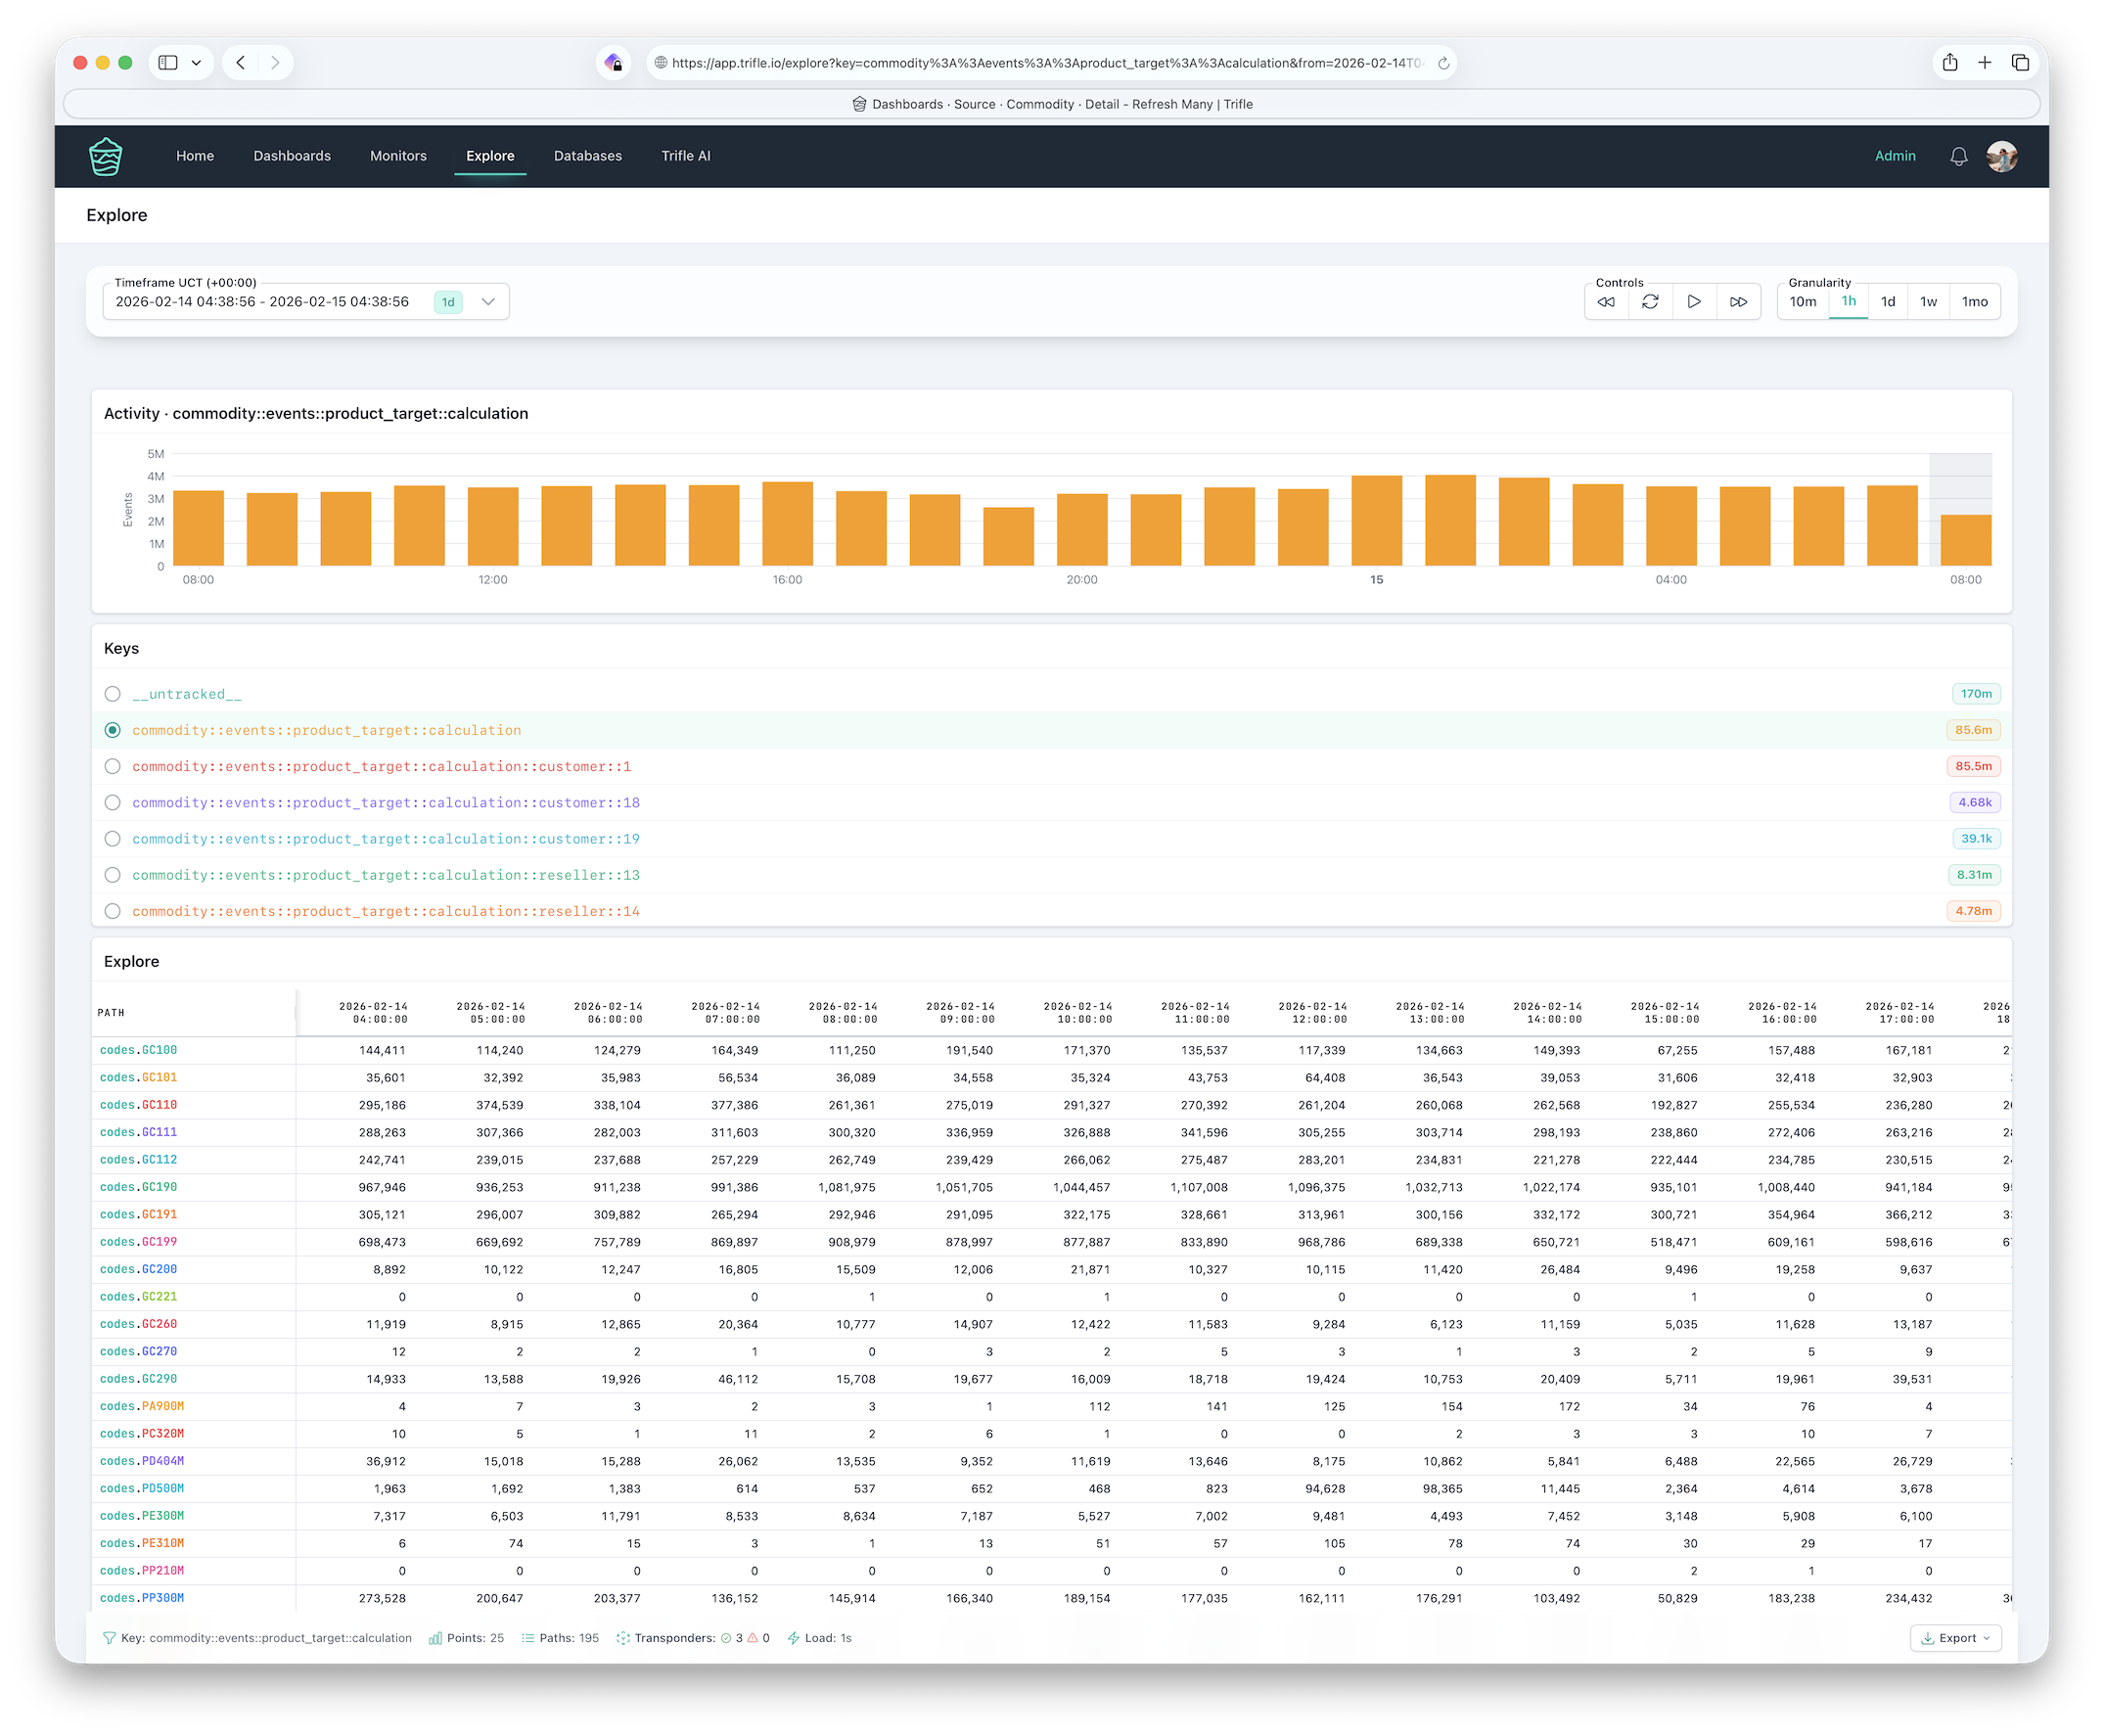
Drill down into the details
Select any key and see its individual paths, code-level breakdowns, and per-bucket values. Understand exactly where your numbers come from.
Hierarchical key structures let you navigate from high-level totals down to individual event paths.
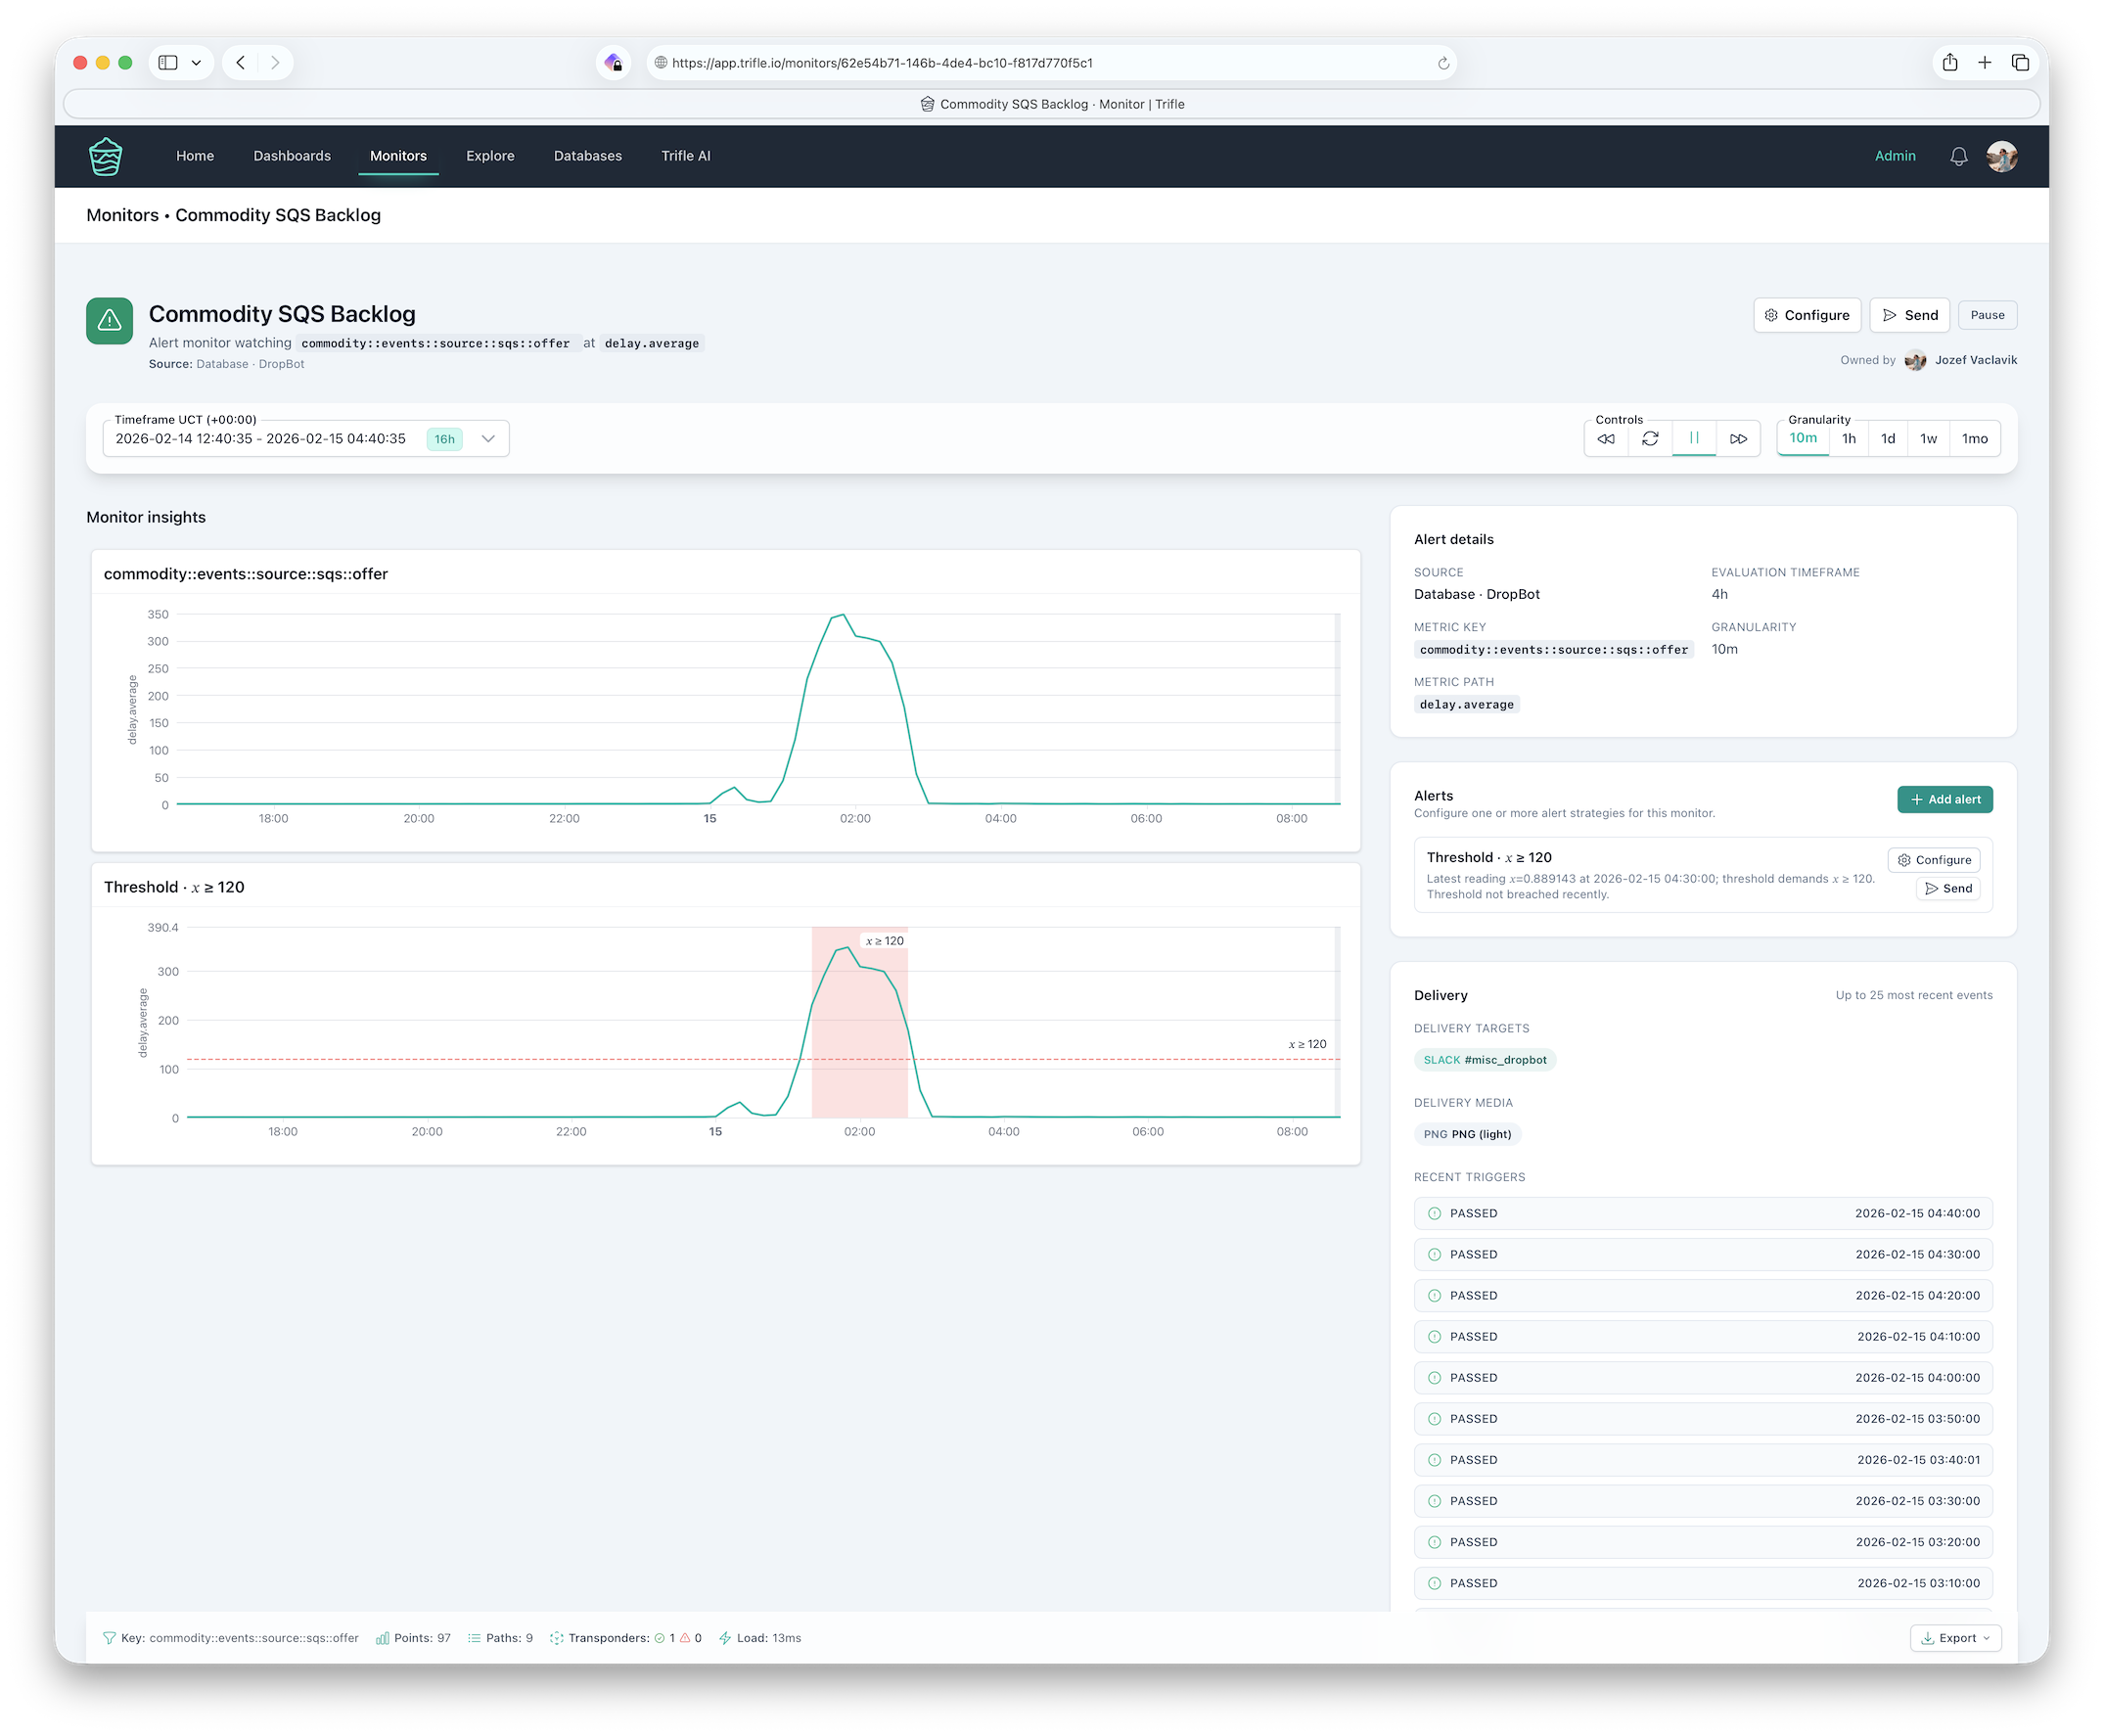
Alerts that watch while you sleep
Set up Threshold, Range, or Anomaly Detection alerts on any metric. When something goes wrong, Trifle fires notifications to Slack, email, or Discord with full context and history.
Anomaly detection uses CUSUM and Hampel filters to catch subtle shifts that simple thresholds miss.
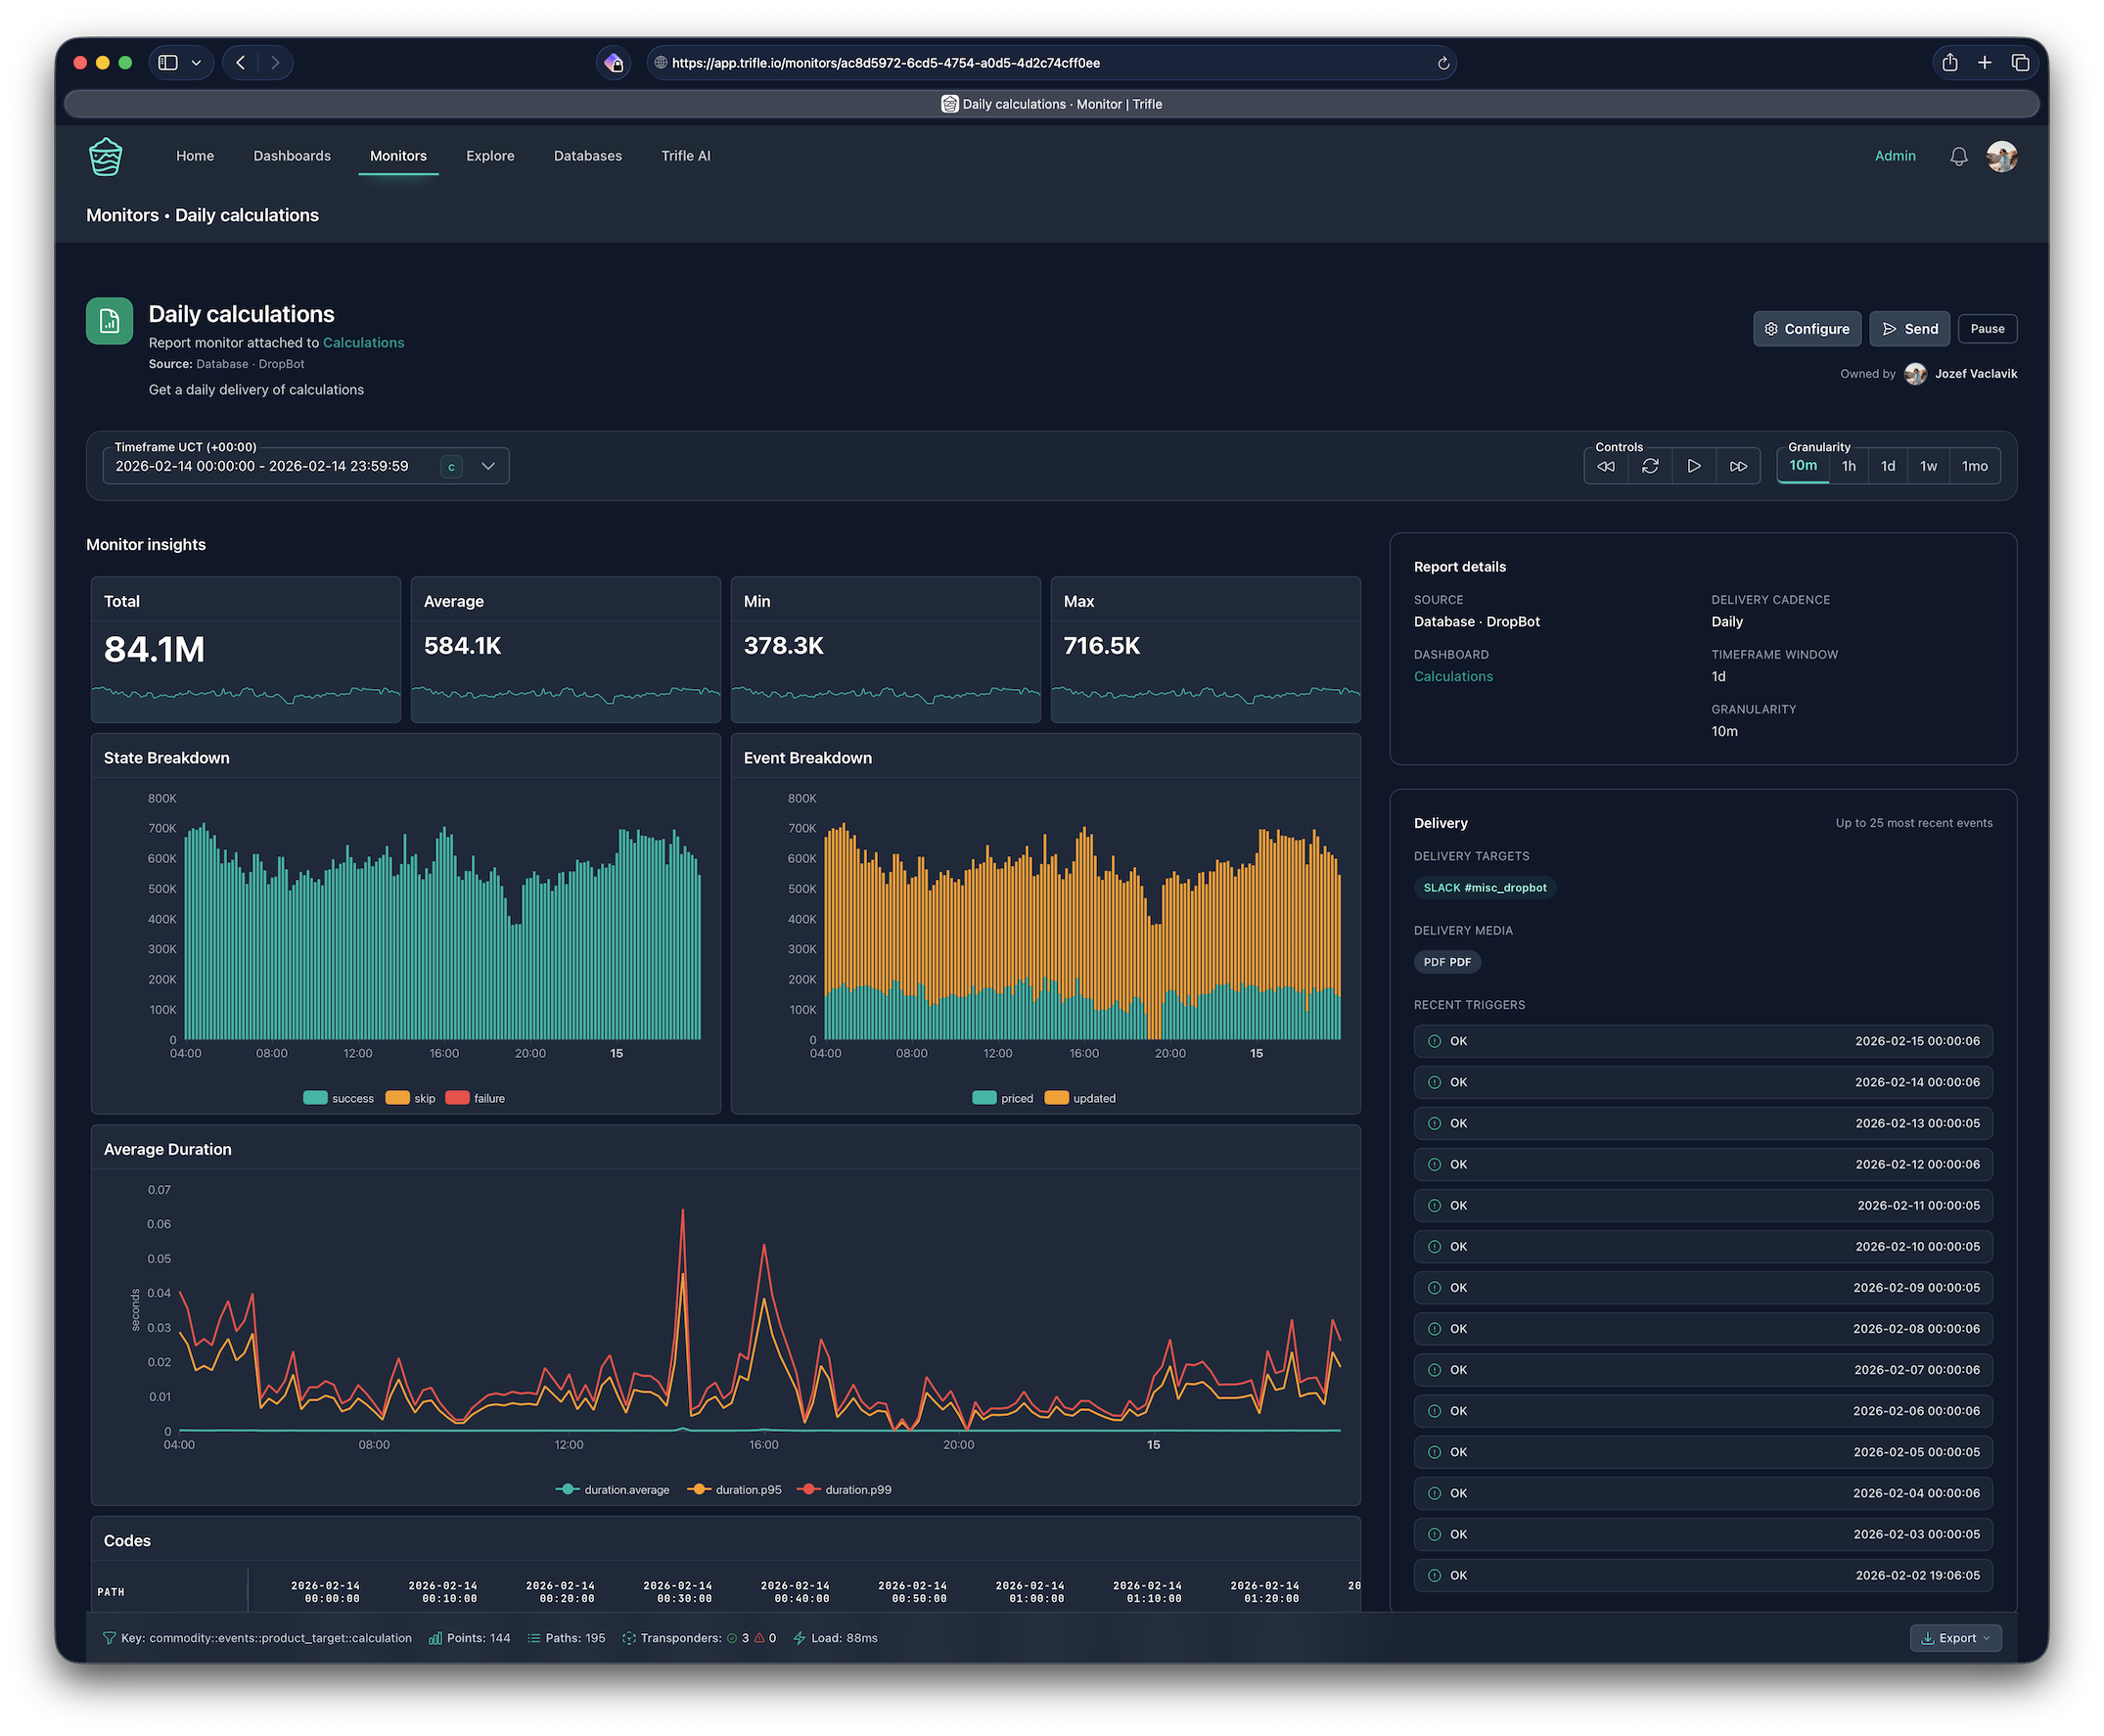
Scheduled reports, delivered
Build a dashboard once, then schedule it for delivery. Reports are snapshots of your dashboards delivered hourly, daily, weekly, or monthly for any timeframe you choose.
Each report captures KPI summaries, charts, and breakdowns as a PDF attachment delivered to Slack or email.
Ask your data anything
Trifle AI analyzes your metrics in natural language. Ask about trends, anomalies, or summaries and get detailed answers with real numbers.
Natural language queries across all your metrics
Trend analysis and anomaly detection insights
AI-recommended alert thresholds and sensitivity
Instant charts and statistical summaries
Flexible data sources
Use our managed storage or connect your own database. Either way, your dashboards just work.
Projects
Managed Storage
Submit metrics via API, we handle storage and aggregation. No database to manage.
- Unlimited keys
- Auto-aggregation
- REST API access
- Configurable retention
Databases
Bring Your Own
Connect your existing MongoDB or PostgreSQL where you already store Trifle Stats data.
- Direct database connection
- Zero data movement
- Full query access
- Your infrastructure
Deploy your way
Start with our managed cloud in seconds, or self-host on your own infrastructure for full control.
Cloud
We handle everything. Infrastructure, updates, storage. Just sign up and start.
- Zero maintenance
- Managed backups
- Auto-scaling
- AI features included
Self-Hosted
Deploy on your infrastructure. Docker and Helm charts. Full data sovereignty.
- Your servers
- Unlimited everything
- AI features (BYOK)
- Docker & Helm
Integrations
Connect Trifle with the tools your team already uses.
Simple, transparent pricing
$39/month
Everything you need to track, visualize, and act on your metrics.
$19/month locked in forever for the first 20 customers.
I'll personally onboard the first 20 customers in a 30-minute session. We'll instrument one real metric together so you can see Trifle working with your own data.
Start tracking in 5 minutes
Sign up, connect your data source, and build your first dashboard.
30-day money-back guarantee. Cancel anytime.