Your queues are moving. But is the work actually working?
Sidekiq tells you jobs ran. Trifle::Stats tells you what they did: success rates, result states, durations, and per-tenant breakdowns. Proven on 100M jobs a day.
The problem
Nothing is screaming, so you assume it works.
There is a funny phase in every background processing system where everything looks fine because nothing is on fire. Sidekiq is processing. Queues are moving. Errors are not exploding. And then you ask a simple question: how many jobs actually did what they were supposed to do today?
Queue stats give you throughput. Error tracking gives you exceptions. Logs give you details if you already know what you are looking for. None of them answers "is this business process healthy?" That is a time-series question, and it deserves time-series data.
What you track
One call at the end of the job. Counters, result states, and duration aggregates.
"Failed" is usually too broad. Some jobs are skipped because source data is missing. Some hit records that were deleted before the job ran. Some finish fine but return a result code that matters. These are all different operational signals, so track them as separate states, not one red line.
Duration gets stored as count, sum, and square. That is enough to compute averages and standard deviation at read time, which beats storing a raw number you can't aggregate later.
In production you'd write the same event to a few keys: global, per customer, per resource. If the global success rate drops, you can immediately ask whether it is everyone or one tenant.
Trifle::Stats.track(
  key: 'jobs::calculations',
  at: Time.zone.now,
  values: {
    count: 1,
    success: 1,
    duration: {
      count: 1,
      sum: duration,
      square: duration**2
    },
    codes: {
      result.status.upcase => 1
    }
  }
)
Cron and scheduled jobs too
The annoying failures are the quiet ones. Cron not running is not an exception.
# tracked from a base class, once,
# for every scheduler in the app
values = {
  count: 1,
  duration: duration,
  resources: resources.count,
  state: { state => 1 }  # success / failure / limited
}

Trifle::Stats.track(key: 'event::schedule',
  at: Time.zone.now, values: values)

Trifle::Stats.track(key: "event::schedule::#{tenant.id}",
  at: Time.zone.now, values: values)
Recurring jobs are easy to start and annoying to trust. Instrument the Cron and Schedule base classes once and every workflow in the app reports itself: invocation counts, resources touched, per-tenant volume, state breakdown.
That answers questions logs can't answer without pain:
- Did this cron job run as often as expected?
- Did a scheduler run but touch zero resources?
- Is one tenant suddenly enqueueing far more work than usual?
- Is duration growing because there is more work, or because something got slower?
Dashboards and alerts on top
Dashboards still require someone to look. Monitors don't.
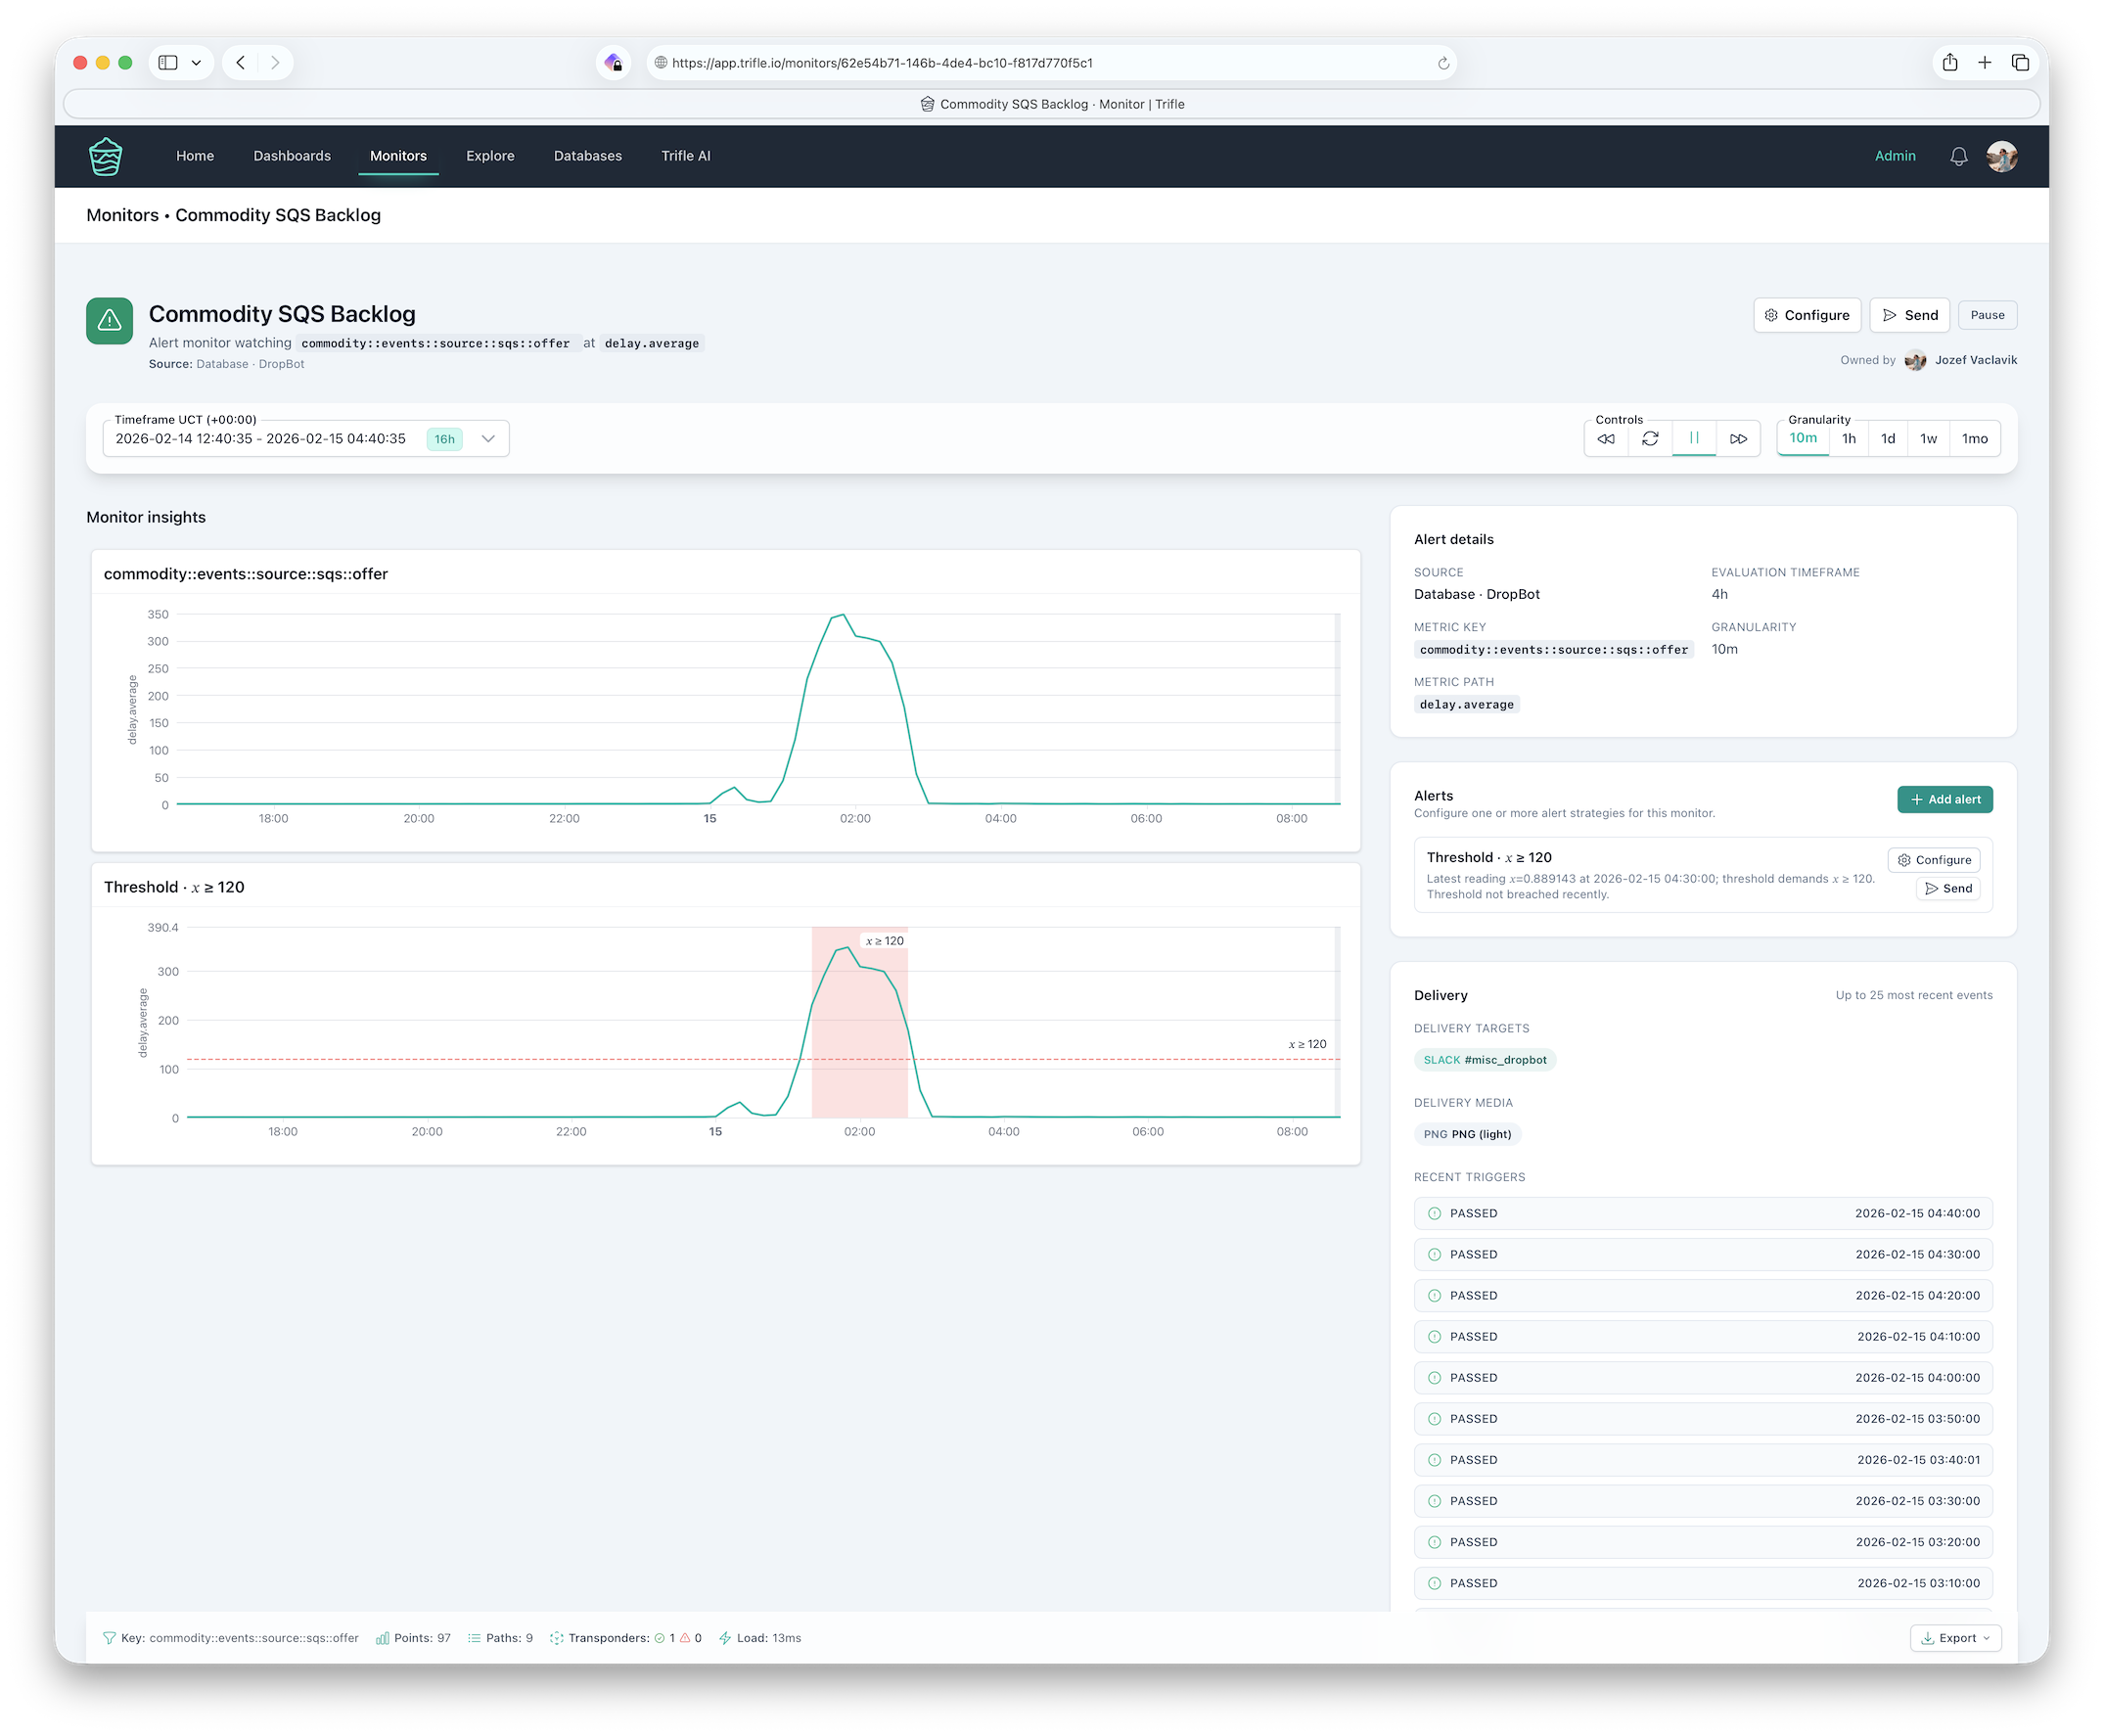
Trifle App reads the same buckets your jobs write and turns them into dashboards with per-job and per-tenant breakdowns. Then monitors take over the watching:
- Cron invocation count below expected range
- Failures above a threshold, or a result code spiking
- Scheduler resources at zero for too long
- Duration drifting upward week over week
At DropBot this setup watches around 100M background jobs a day. The instrumentation is a few lines in two base classes.
Keep reading
The production stories this page is based on.
Know what your workers did today
Small code change. Big operational value.