One track call. Every granularity. Your database.
What actually happens between a Trifle::Stats.track call in your code and a chart on a dashboard. No pipeline, no magic. Just buckets.
Track: one call, a whole tree of counters
You give it a key, a timestamp, and a hash of values. That's the entire integration surface.
Configuration is one initializer. Pick a driver for the database you already run, list the granularities you care about, set your timezone. Done.
Then you track. The interesting part is that values is not a single number. It is a hash, and it can be nested. Every numeric leaf gets incremented. One call below increments the order totals plus the per-payment-method and per-channel breakdowns.
Most counter tools give you one number per metric. Trifle gives you a tree of numbers under a single key. That is the difference that makes everything downstream work.
Trifle::Stats.configure do |config|
  config.driver = Trifle::Stats::Driver::Postgres.new(ActiveRecord::Base.connection)
  config.granularities = ['1h', '1d', '1w', '1mo']
  config.time_zone = 'UTC'
end
Trifle::Stats.track(
  key: 'orders::completed',
  at: Time.zone.now,
  values: {
    count: 1,
    revenue_cents: order.total_cents,
    payment: { order.payment_method => { count: 1 } },
    channel: { order.channel => { count: 1 } }
  }
)
Store: buckets for every granularity
Trifle does not store events. It increments pre-aggregated rollups, one document per key, granularity, and time bucket.
{
  "count"         => 128,
  "revenue_cents" => 1034400,
  "payment" => {
    "card"   => { "count" => 97 },
    "paypal" => { "count" => 31 }
  },
  "channel" => {
    "web"    => { "count" => 84 },
    "mobile" => { "count" => 44 }
  }
}Every track call lands in one bucket per configured granularity. With '1h', '1d', '1w', '1mo' that is four small writes: the hourly bucket, the daily bucket, the weekly bucket, the monthly bucket. Each bucket is a single document that keeps counting up.
The increments are atomic and happen inside your database, not in your app. On Postgres it is one INSERT ... ON CONFLICT DO UPDATE built from jsonb_set calls. On MongoDB it is $inc. On Redis it is hincrby. No read-modify-write, no race conditions between workers.
Drivers are small adapters that implement the same five operations: inc, set, ping, get, scan. Databases that can't store nested hashes get them packed into dot-notation keys automatically.
Incoming Events
Time Buckets
Retrieve: values, series, and the math on top
Reads are cheap because the aggregation already happened at write time. You just pick a timeframe and a resolution.
values returns two parallel lists: timestamps and the bucket documents for them. That raw shape is enough for a chart or a quick console answer.
Aggregators
Wrap the result in a series and you can run math over any dot-path in the tree. Sum, mean, min, max. The path payment.card.count was never declared as a metric anywhere. It just falls out of the data model.
Formatters
Timeline and category formatters reshape a series for charting libraries. Timestamped pairs for line charts, grouped totals for donuts.
Transponders
Transponders derive new values inside a series from expressions. Success rate from two counters, averages from sum and count, standard deviation from sum, count, and square. Track raw ingredients, compute the insight at read time.
Trifle::Stats.values(
  key: 'orders::completed',
  from: 30.days.ago, to: Time.zone.now,
  granularity: '1d'
)
# => { at: [30 timestamps], values: [30 bucket docs] }
series = Trifle::Stats.series(
  key: 'orders::completed',
  from: 30.days.ago, to: Time.zone.now,
  granularity: '1d'
)

series.aggregate.sum(path: 'revenue_cents')
series.aggregate.sum(path: 'payment.card.count')
series.aggregate.max(path: 'count')

series.transpond.expression(
  paths: ['revenue_cents', 'count'],
  expression: 'a / b',
  response: 'aov'
)
Query Request
Response
Time Buckets
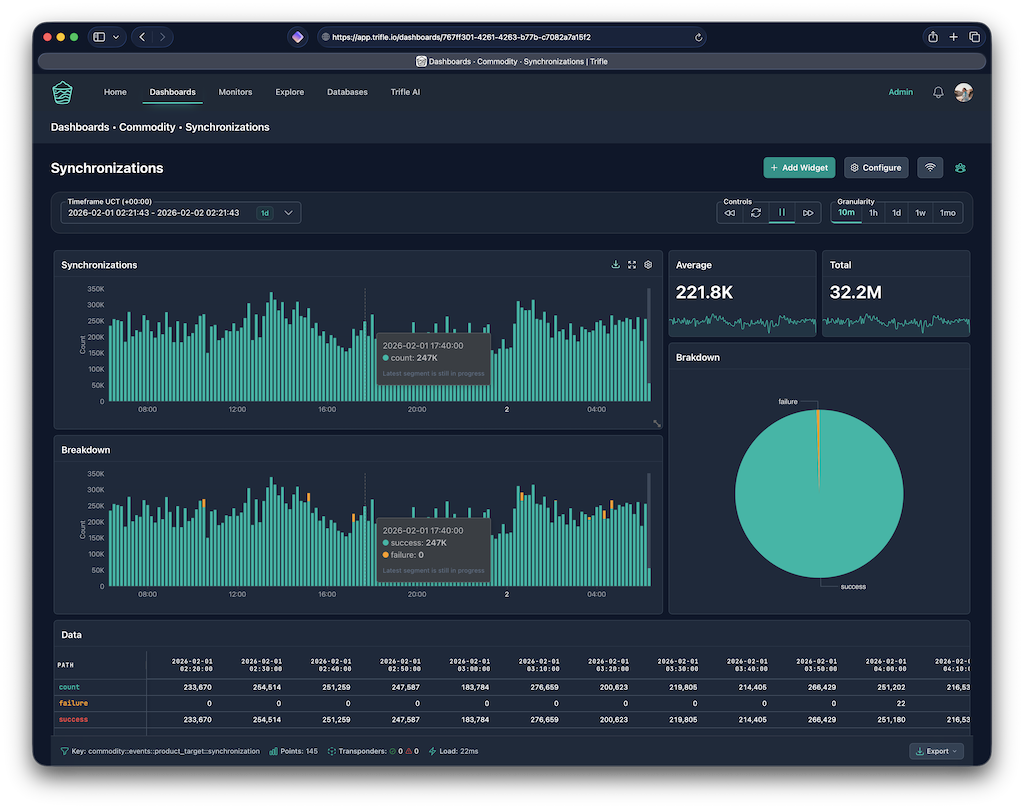
Trifle App: dashboards on the same database
The library is the write half. Trifle App is the read half your team actually looks at.
Trifle App connects to the PostgreSQL or MongoDB where your stats already live and reads the same buckets your app writes. No export step, no sync job, no second copy of the data. Database sources are read-only from the App's perspective.
On top of that read path you get:
- Dashboards. Drag-and-drop widgets mixing time-series charts, category breakdowns, and KPI numbers over any key and path.
- Alerts. Threshold, Range, and Anomaly Detection monitors that fire to Slack, email, or Discord when a metric misbehaves.
- Digests. Scheduled reports that snapshot a dashboard and deliver it hourly, daily, weekly, or monthly.
If you'd rather not connect a database at all, managed Projects accept metrics over the API and we handle storage. Either way, dashboards just work.
And when the reader is not human
The same data is reachable from the terminal and from AI agents.
Trifle CLI queries and pushes the same metrics from your shell, works fully offline with a zero-config local SQLite database, and runs as an MCP server so coding agents can query your metrics with full context of your code. There is a whole use case built around that workflow.
Start with one metric
The one you keep computing by hand in the console is a good candidate.