Business KPIs at a glance
Daily signups, churn, funnel steps, and the numbers your Monday meeting actually runs on. Tracked from code, readable by everyone.
The problem
The KPI spreadsheet is always one week stale.
Signups, activations, churned accounts, funnel conversion. Every team tracks them, and in most companies they live in a spreadsheet that someone updates by hand from console queries. The numbers are stale by Monday and disputed by Tuesday.
These are counters with timestamps. Your app can keep them itself, in real time, with one definition everyone shares.
What you track
One call per business event, at the moment it happens.
Each KPI is a track call at the place where the event actually happens: the signup controller, the cancellation service, the activation callback. Nest the breakdowns you'll want later, like plan or source.
Because buckets roll up hourly, daily, weekly, and monthly at write time, "this month vs last month" needs no batch job. The monthly bucket already exists.
Trifle::Stats.track(
  key: 'kpi::signups',
  at: Time.zone.now,
  values: {
    count: 1,
    plan: { user.plan => 1 },
    source: { user.signup_source => 1 }
  }
)
What you get back
The Monday numbers, from the console or the dashboard.
Placeholder. This section will show the retrieval side: weekly signup trends, plan mix as a category breakdown, and churn rate derived with a transponder expression over two tracked counters.
The dashboard the whole company reads
KPI numbers, trend charts, and a Monday digest to the leadership channel.
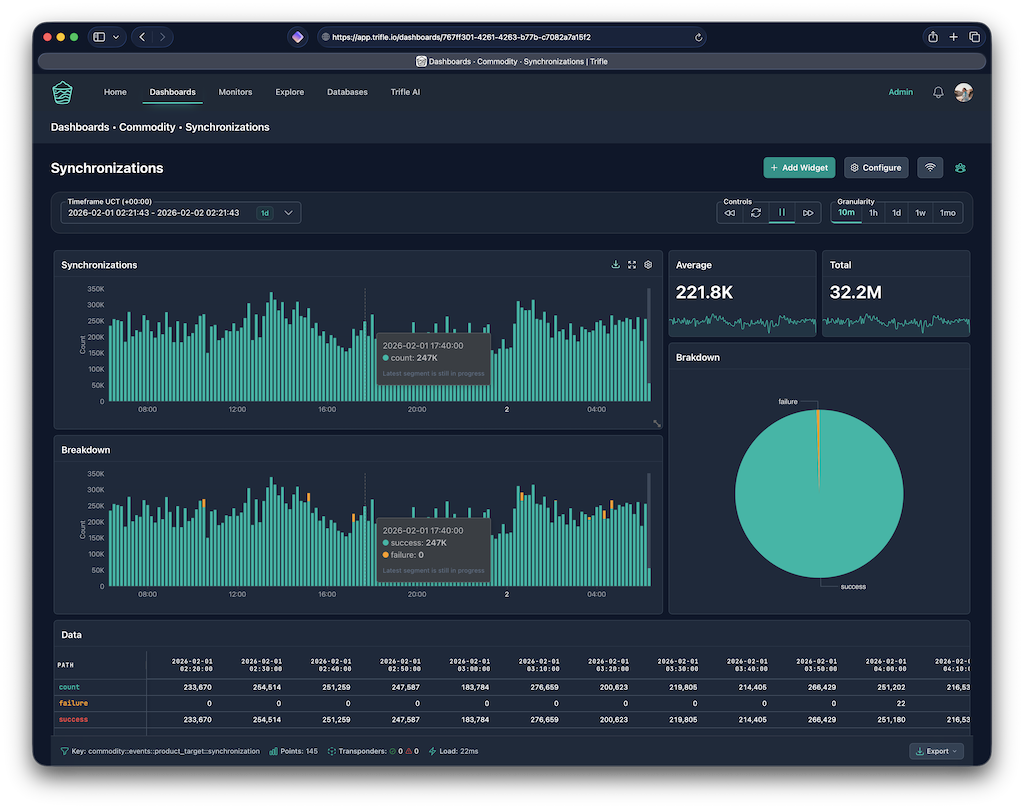
Placeholder. This section will walk through the KPI dashboard layout: KPI number widgets for the headline metrics, trend lines for signups and churn, category splits by plan and source, and a scheduled weekly digest.
Keep reading
Related patterns and guides.
Retire the KPI spreadsheet
Track the events once, argue about the numbers never.