Know which features actually get used
Adoption by feature, by plan, by segment. Counted in your own database, without shipping user behavior to a third-party analytics tool.
The problem
You shipped it three months ago. Is anyone using it?
Every roadmap discussion eventually hits the same wall: nobody knows which features carry the product and which ones are dead weight. The usual answer is bolting on a product analytics suite, sending user events to someone else's cloud, and paying per event for the privilege.
If what you actually need is "how often was this used, and by which plan", that is a counter. You can keep counters yourself.
What you track
One call in the controller or service where the feature fires.
Nest the feature name and the plan under one key and every use increments the total plus both breakdowns. The whole adoption picture lives under features::used.
The one rule: nest only small, fixed sets. Feature names and plans qualify. Individual users don't, so if you ever need per-user counts, put the user in the key (features::used::user::42) instead of the payload.
That is the entire integration. No SDK, no snippet, no consent banner for a third-party processor.
Trifle::Stats.track(
  key: 'features::used',
  at: Time.zone.now,
  values: {
    count: 1,
    feature: { csv_export: 1 },
    plan: { current_user.plan => 1 }
  }
)
What you get back
Adoption questions become one-liners.
series = Trifle::Stats.series(
  key: 'features::used',
  from: 90.days.ago, to: Time.zone.now,
  granularity: '1w'
)

# Is CSV export catching on?
series.aggregate.sum(path: 'feature.csv_export')

# Do pro users behave differently?
series.aggregate.sum(path: 'plan.pro')
series.aggregate.sum(path: 'plan.free')

# Weekly usage trend for the chart
series.format.timeline(path: 'count')
Weekly granularity is usually the honest one for adoption. Daily numbers wiggle, weekly numbers trend.
Every feature you tracked is its own dot-path, so "is anyone using the thing we shipped in April" is a single aggregate call, not a data request ticket.
And because plans are nested alongside features, you can see whether a feature is loved by the users who pay or only by the ones who don't. That changes roadmap conversations.
A dashboard the PM opens themselves
The point of tracking adoption is not asking engineering for numbers.
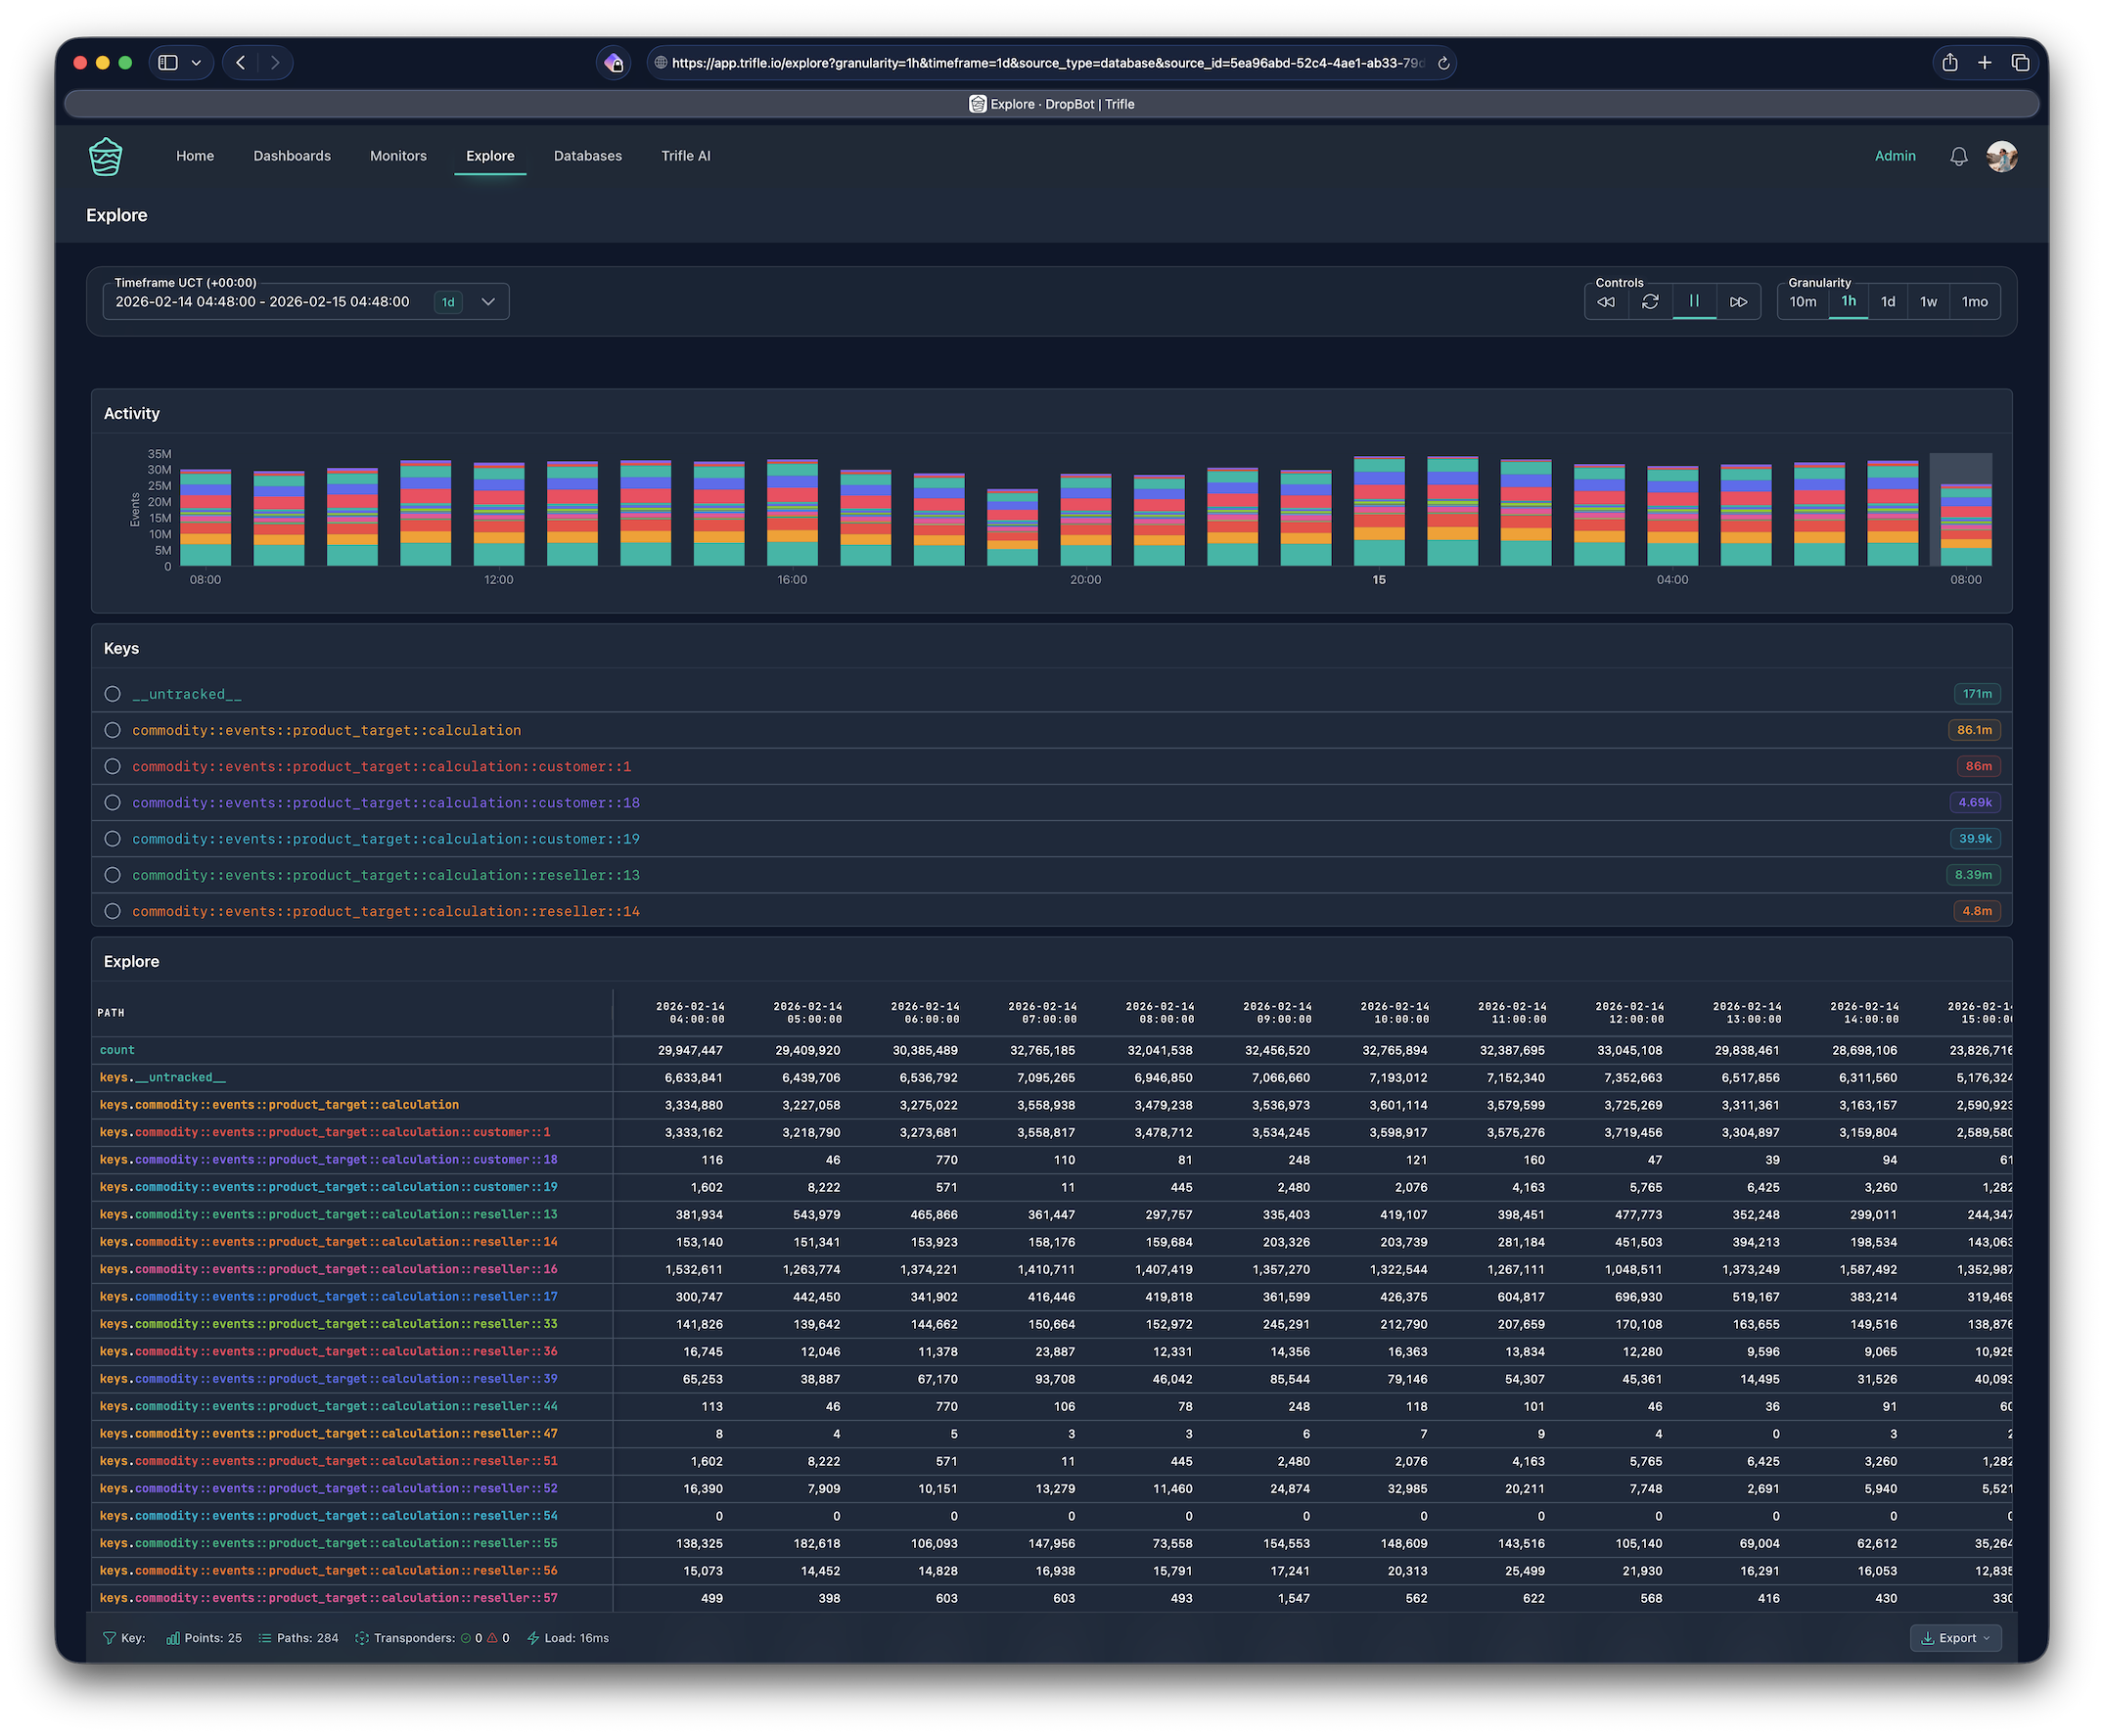
Hook Trifle App to the same database and the feature usage dashboard is a few widgets: usage over time, category breakdown by feature, plan split. Non-technical teammates browse it without touching a console.
- Category widgets ranking features by usage over any timeframe.
- Weekly digest to the product channel, so adoption is a habit, not an audit.
- Anomaly alerts when usage of a core feature suddenly drops. Sometimes that is a bug report before the bug report.
Keep reading
The patterns behind this page.
Settle the roadmap argument with data
Start counting today, know by next sprint.