Learn how DropBot keeps track of analytics.
DropBot and Analytics
Link: dropbot.sh
At DropBot one of our domain focuses on product price calculation. Currently we're calculating around 10+ million products throughout day. Any time source data or other input for a product changes, we automatically update the calculation.
We use Trifle::Stats to gain visibility into many parts of our system and I believe product pricing is the one that adds the most value for us. As I mentioned above, we run calculation any time some data changes. Under the hood we have two main sources of data that triggers product calculation.
Being able to track these source events and calculations with results is providing us an insight into how our system is operating. It allows us to see any issues that would otherwise go by undetected. This way we can share details with our customers before they even notice that something seems off. We have now visibility into both recent changes and spikes as well as long term trends.
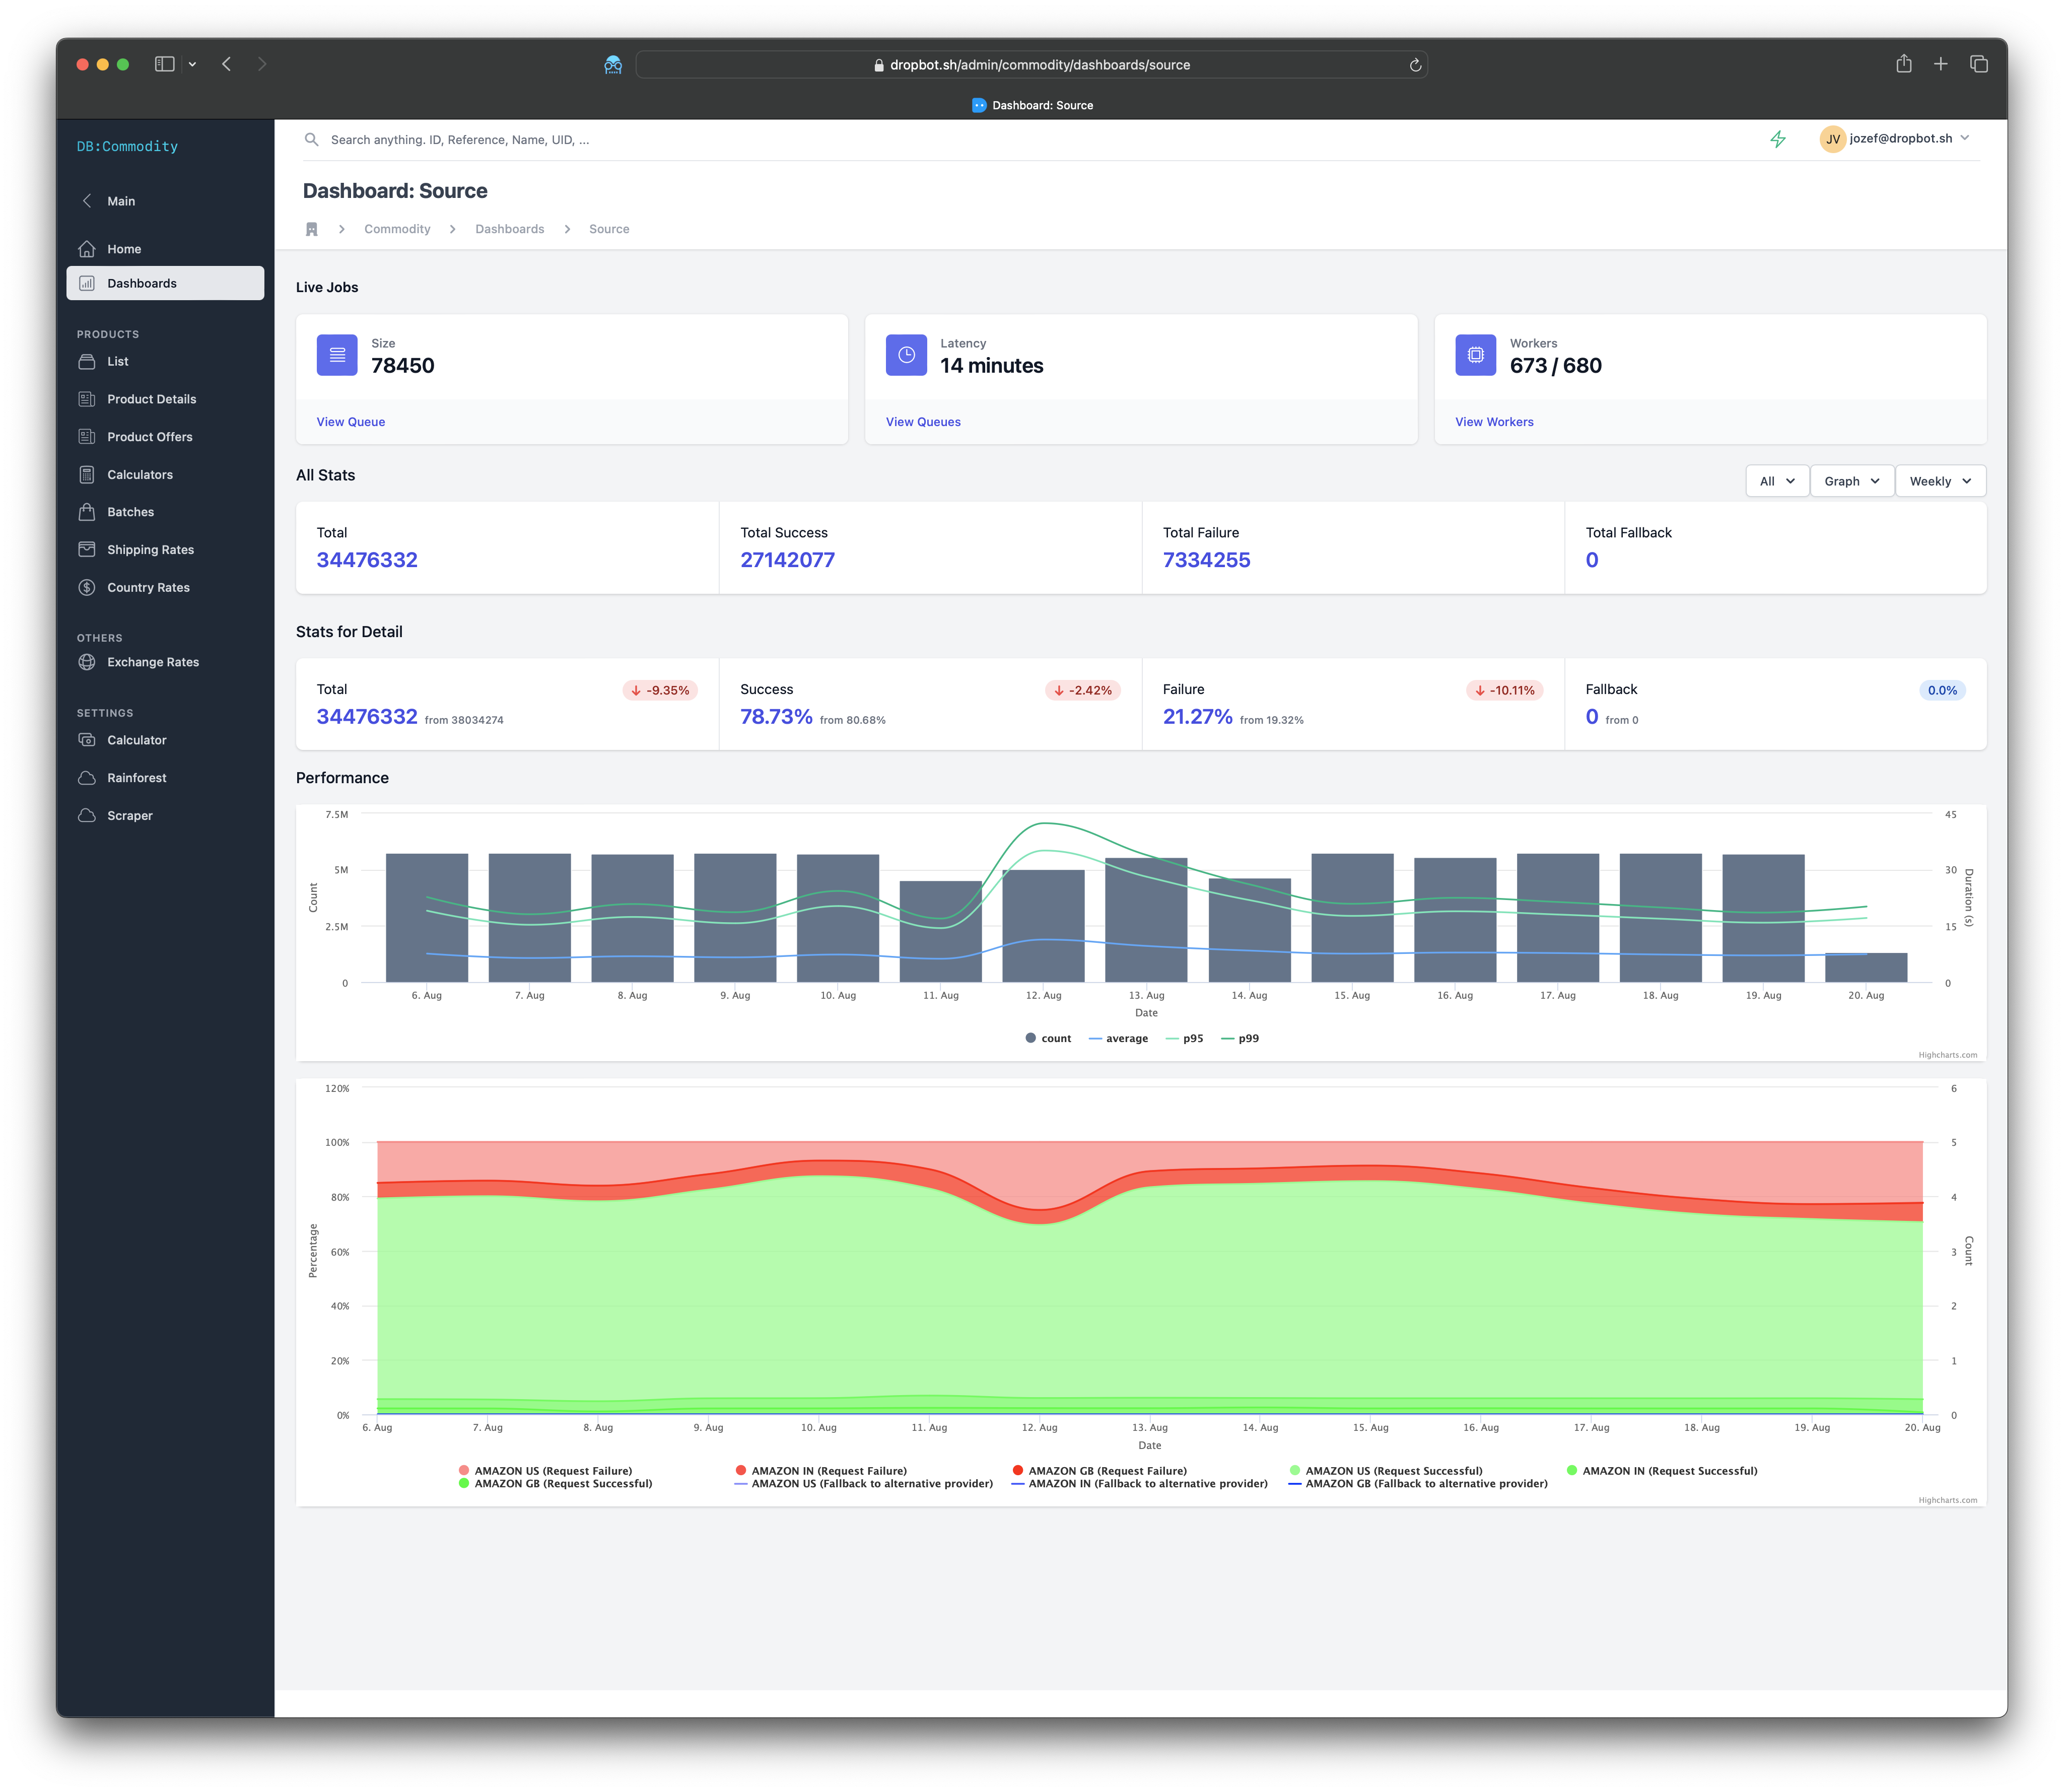
Take for example analytics about source data. These are details about products that we periodically refresh every day. Our usecas doesn't require us to store data per-minute, so per-hour and greater is completly sufficient for us. Any recent spike is quiet easily visible on hourly basis and data quality degradation over longer period can be visible on the daily charts. The screenshot below illustrates that scenario.

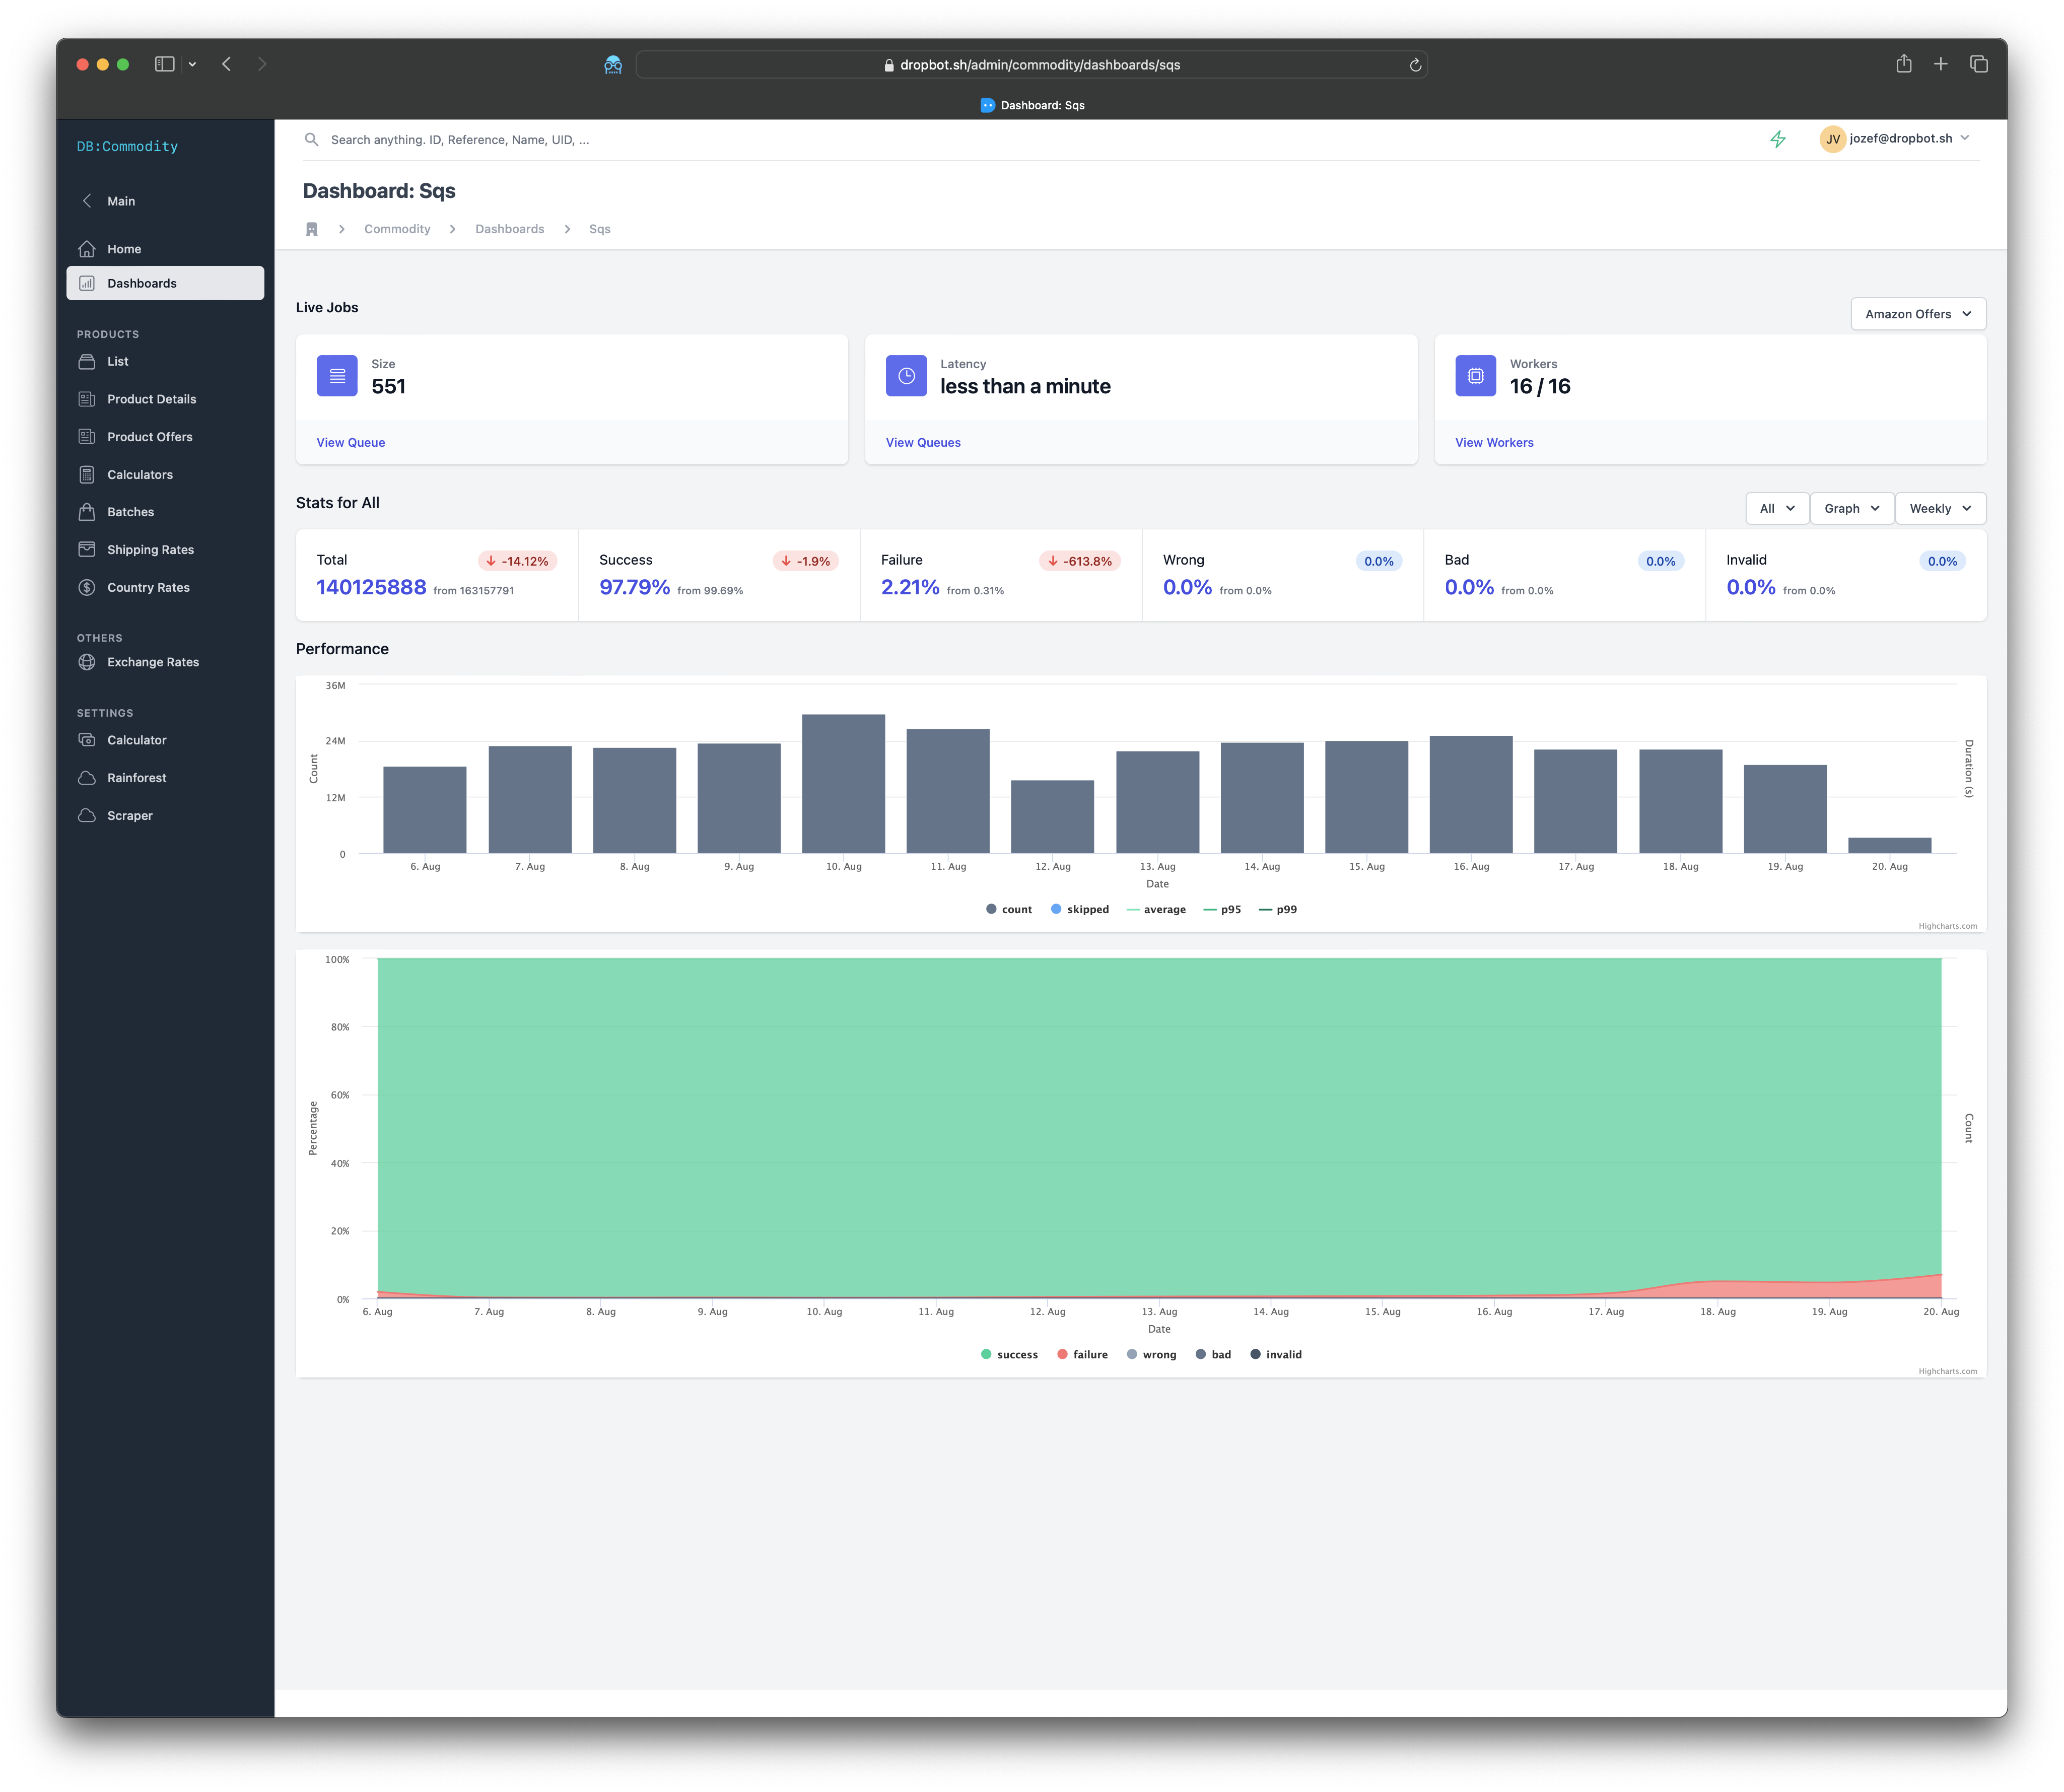
Another trigger comes from data we receive through SQS notifications. There is no performance data how fast these gets processed as its speed is consistent. On the other side we want to track the corectness of the content.

When you combine these two triggers you start getting idea of events that trigger the calculations and if there is anything unusual happening at either side of them. Then we can move to actual calculation stats. This is where Trifle::Stats helps us a lot.
Seeing breakdown for the source data provides visibility into why some calculations were triggered.